



FY 2026 Operating Budget
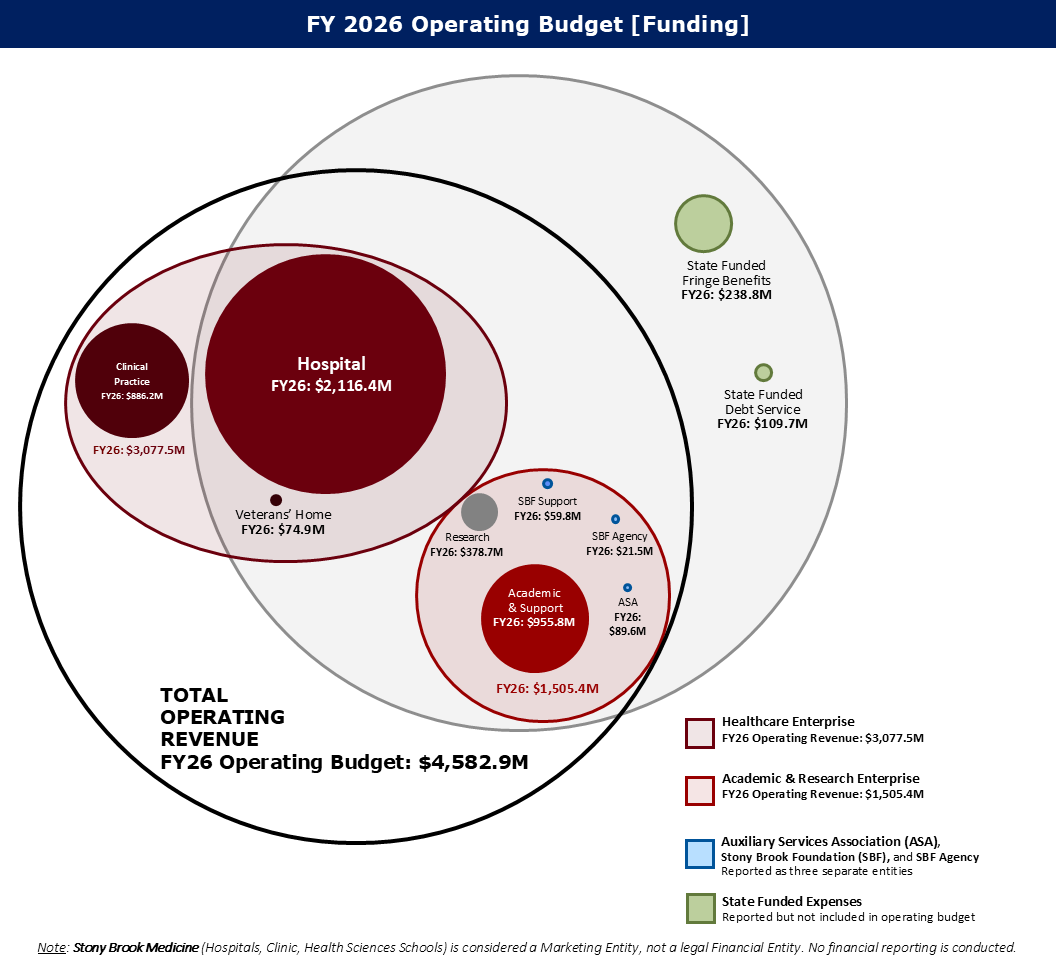
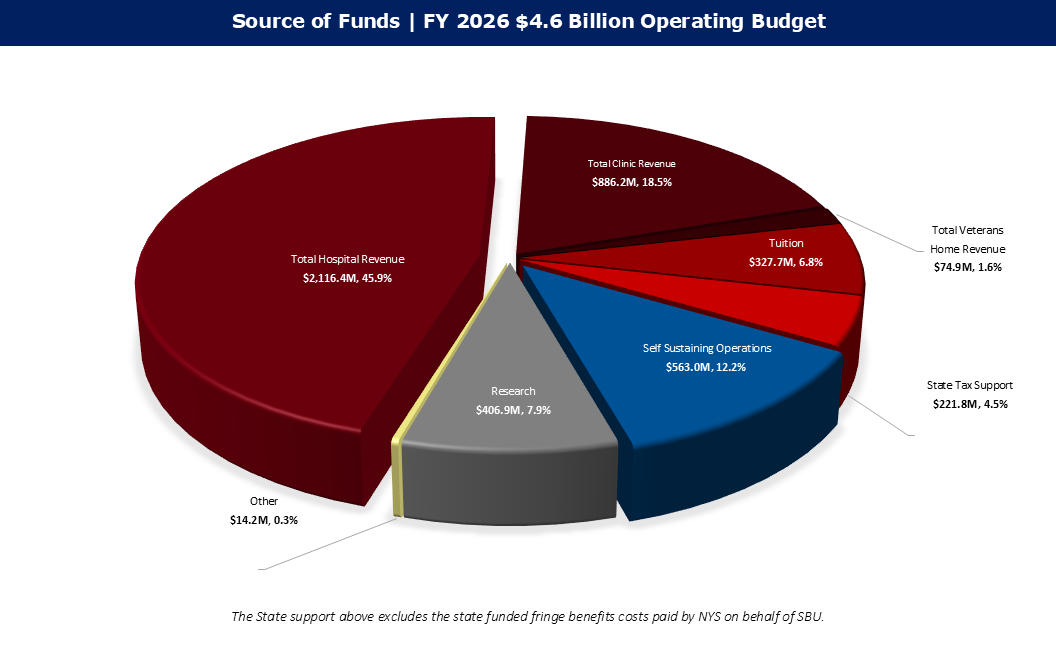
Stony Brook University’s FY26 operating budget reflects total projected revenue of
$4.6B. This structure encompasses the University’s healthcare, academic, and administrative
functions, while maintaining separate tracking for state-funded obligations.
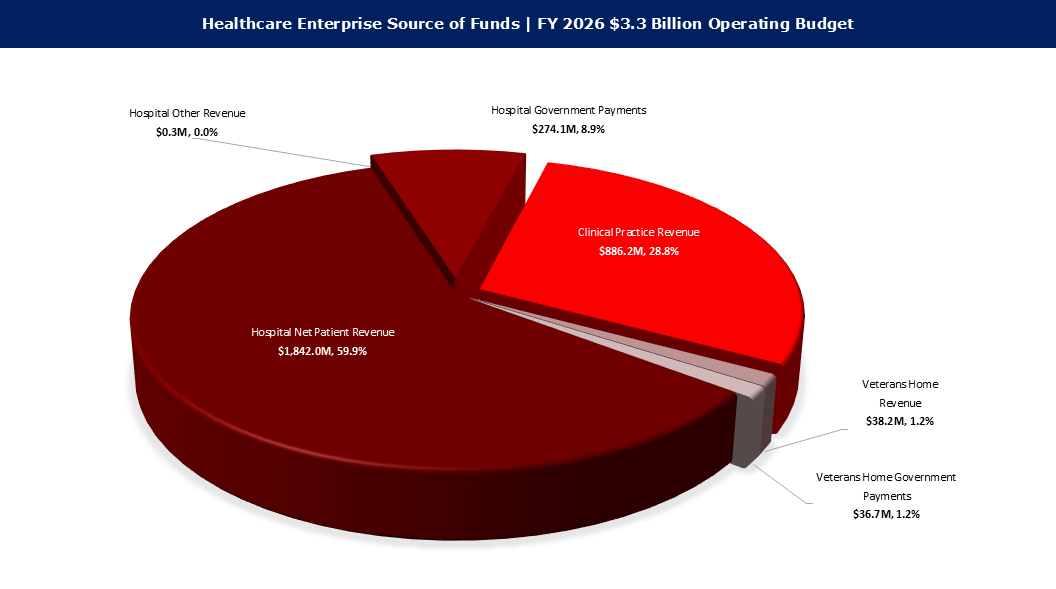
The Healthcare Enterprise, which includes the hospital, clinical practices, and Veterans
Home, represents the largest portion of the revenue budget at $3.1B. Hospital Revenue,
inclusive of patient billings and affiliate hospital income, accounts for $1,842.0M
(59.9% of healthcare revenue), while Clinical Practice Revenue contributes $886.2M
(28.8%). Hospital Government Payments total $274.1M (8.9%), and total Veterans Home
revenue is budgeted at $74.9M (2.3%).
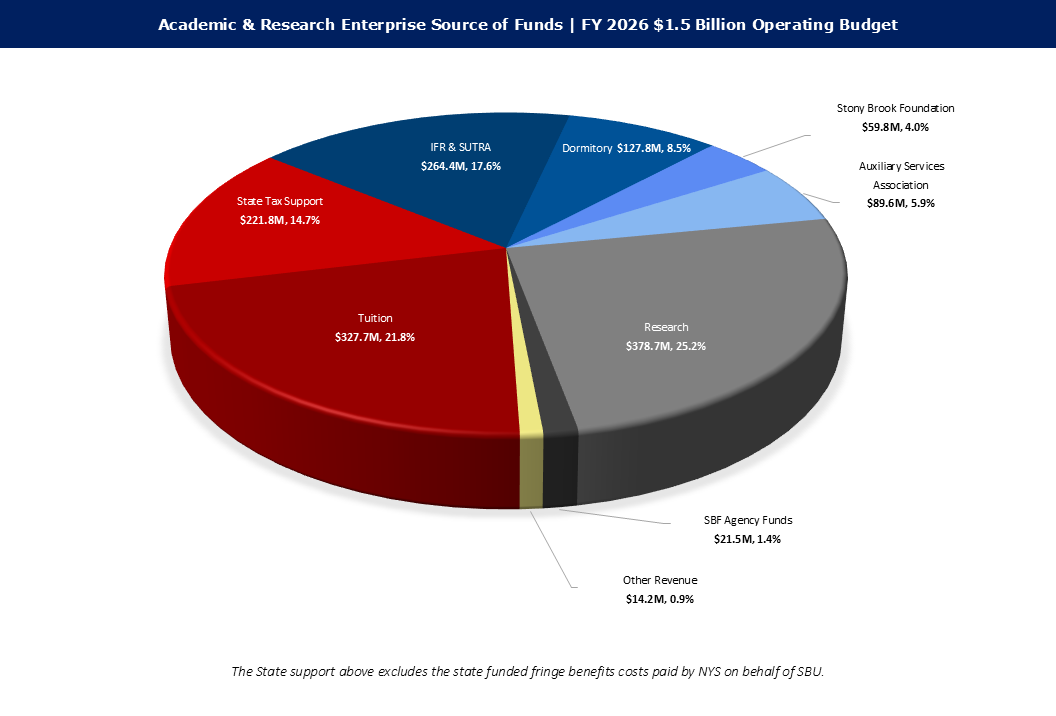
The Academic & Research Enterprise is budgeted at $1.5B, with a more distributed revenue
structure. Research activities account for $406.9M (26.5%), Tuition contributes $327.7M
(21.8%), and IFR & SUTRA totals $264.4M (17.2%). State Tax Support of $221.8M (14.5%)
reflects continued state investment in the University’s academic mission. Dormitory
revenue of $127.8M (8.5%) is budgeted in line with the anticipated enrollment and
occupancy levels.
The grid at the bottom of this section contains an overview of budgeted revenue versus
budgeted expenses. There are anticipated in-year gaps for both the Healthcare Enterprise
and the Academic & Research Enterprise. Please note, the bulk of the Academic & Research
Enterprise gap will be covered by planned drawdown of reserves specifically in IFR,
SUTRA, and SBF Support Funds.
REVENUE: FY 2026 Operating Budget
EXPENSES: FY 2026 Operating Expenses Budget
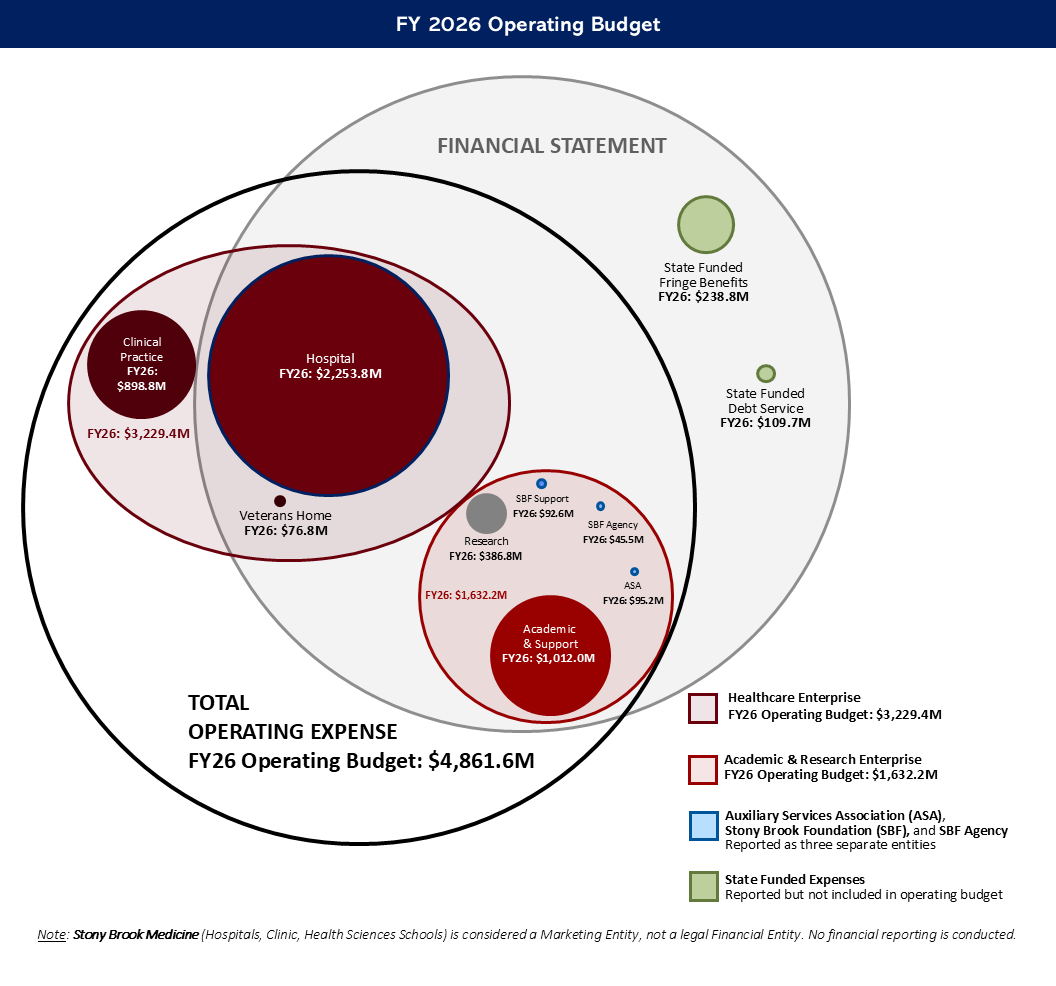
Stony Brook University’s FY26 operating budget outlines a comprehensive financial structure managing $4.9B in expenses across its major divisions. This structure reflects the complex interplay between the institution’s healthcare, academic, and administrative functions, while maintaining separate tracking for state-funded obligations.
The Healthcare Enterprise, which includes the hospital, clinical practices, and Veterans
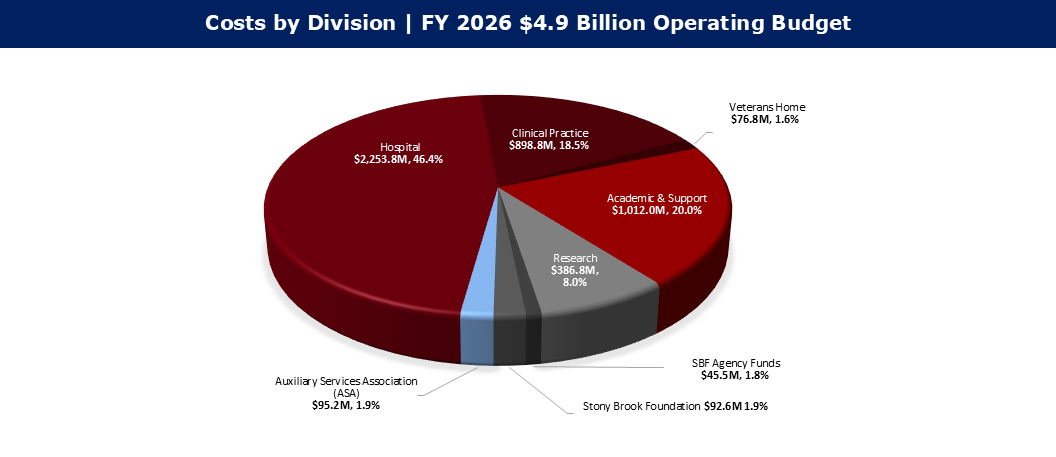
Home, represents the largest portion of the expense budget at $3.2B. Hospital operations
account for $2,253.8M (46.3% of total costs), while clinical practices contribute
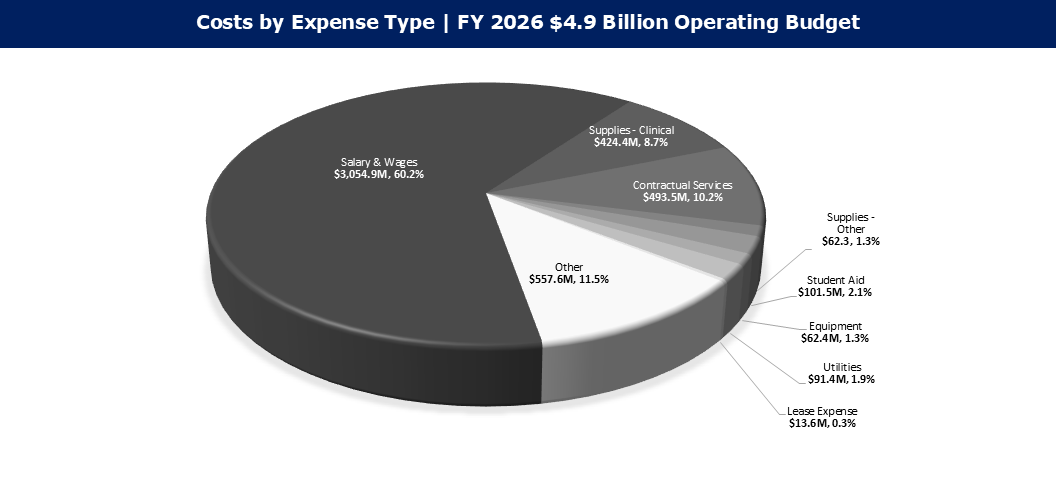
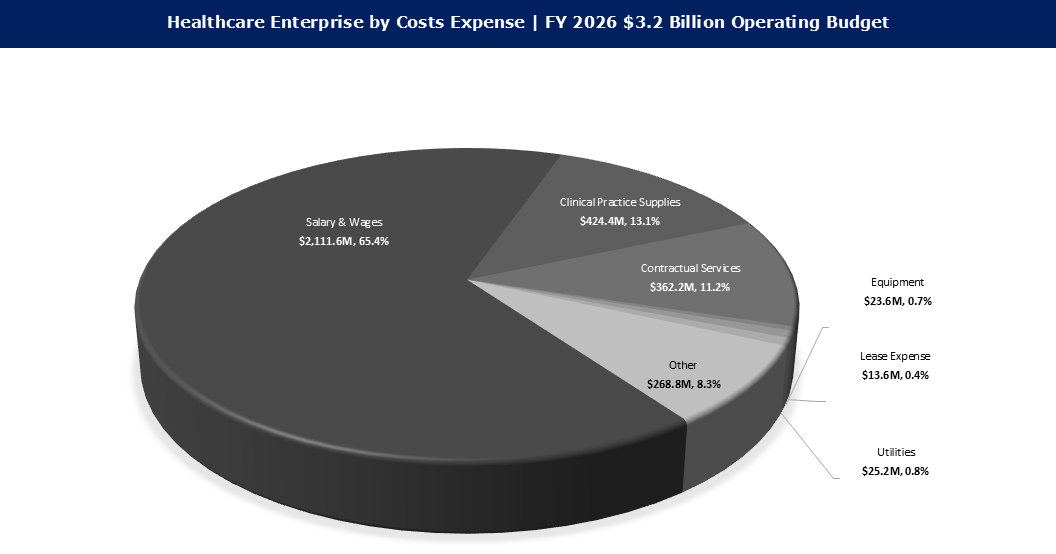
$898.8M (18.5%). The healthcare division’s expenses are predominantly driven by salary
and wages, which constitute 65.4% ($2,111.6M) of its budget, followed by clinical
supplies at 13.1% ($424.4M) and contractual services at 11.2% ($362.2M).
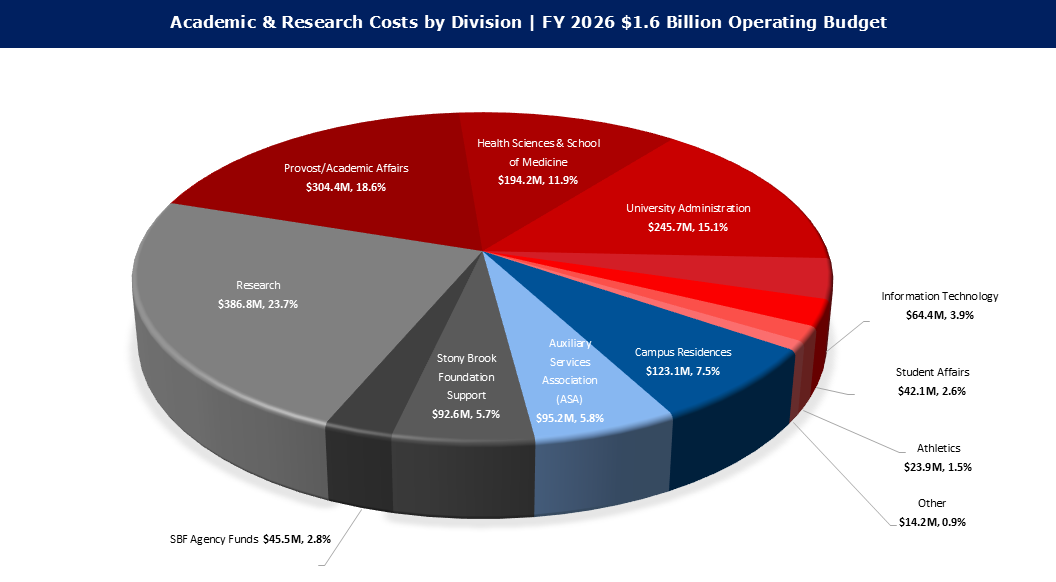
The Academic & Research Enterprise manages approximately $1.6B in budgeted expenses,
with a more distributed cost structure. Research activities account for $386.8M (23.6%),
while Provost/Academic Affairs expenses total $304.4M (18.6%), University Administration
costs reach $245.7M (15.0%), and Health Sciences and the Renaissance School of Medicine
total $194.2M (11.9%). Similar to the healthcare division, the academic enterprise’s
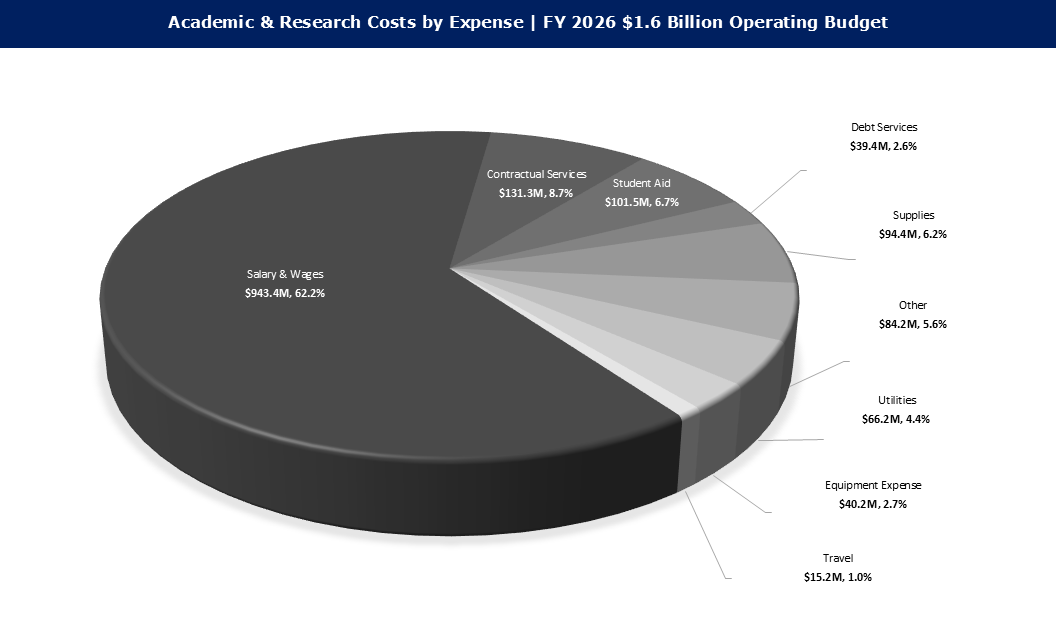
largest expense category is salary and wages, representing 57.6% ($943.4M) of its
budget.
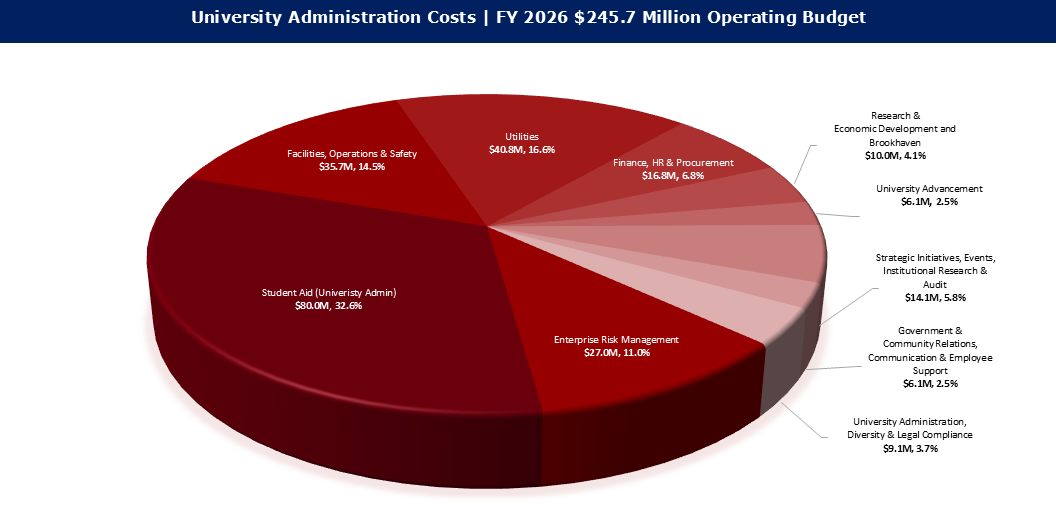
Within the University Administration’s $245.7M budget, the largest allocations go to Student Aid ($80.0M, 32.6%), Utilities ($40.8M, 16.6%), and Facilities, Operations & Safety ($35.7M, 14.5%).
The Stony Brook Foundation expense budget of $92.6M primarily supports Provostial units ($34.4M, 37.2%), and Advancement activities ($18.1M, 19.5%), and Stony Brook Medicine ($17.9M, 19.3%).
In addition to the highlights of the FY 2026 expense budget described above, it is
also important to note the FY26 revenue budget. The grid at the bottom of this section
contains an overview of the budgeted revenue versus the budgeted expenses. There are
anticipated in-year gaps for both the Healthcare Enterprise and the Academic & Research
Enterprise. Please note, the lion’s share of the Academic & Research Enterprise gap
represents a planned use of reserves specifically in IFR, SUTRA, and SBF Support funds.
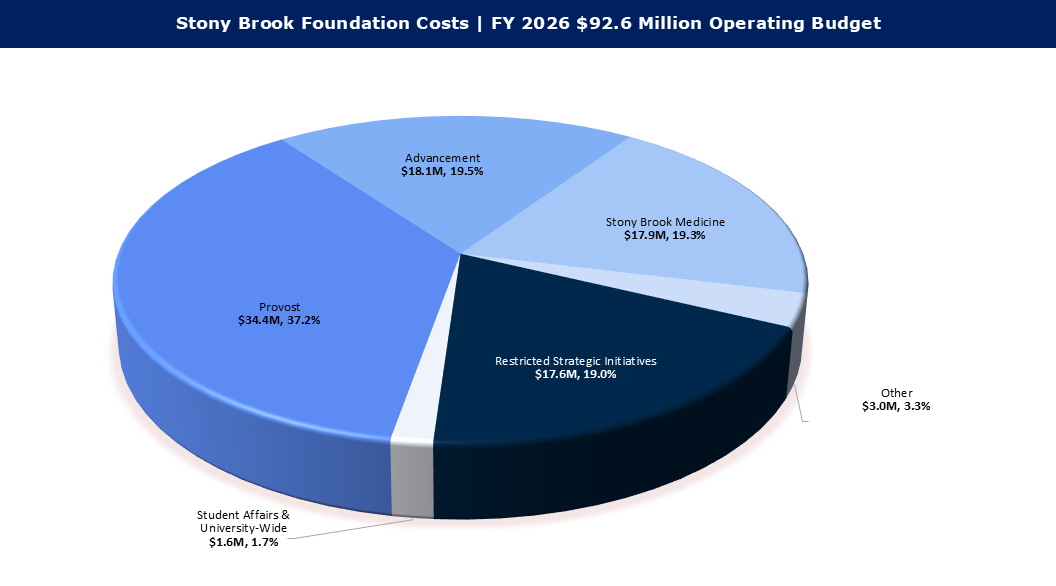
The Stony Brook Foundation expense budget of $92.6M primarily supports Provostial units ($34.4M, 37.2%), Restricted Strategic Initiatives ($17.6M, 19.0%), and Advancement activities ($18.1M, 19.5%).
FY 2026 FUNDING vs. COSTS
FY 2026 Operating Budget - Funding vs. Costs
Overall, the FY26 operating budget reflects anticipated in-year gaps across both enterprises. The lion’s share of the Academic & Research Enterprise gap represents a planned use of reserves specifically for IFR, SUTRA, and SBF Support funds. Note that figures may not foot due to rounding.
| Healthcare Enterprise | Funding | Costs | Surplus (Deficit) |
| SBU Hospital | $1,755M | $1,854M | ($99M) |
| Southampton Hospital | $283M | $321M | ($38M) |
| Eastern Long Island Hospital | $78M | $78M | ($1M) |
| Clinical Practices | $886M | $899M | ($13M) |
| Veterans Home | $75M | $77M | ($2M) |
| Total Hospital and Clinic | $3,078M | $3,229M | ($152M) |
| Academic & Research Enterprise | Funding | Costs |
Surplus (Deficit) |
| Total Academic and Research | $1,533M | $1,637M | ($104M) |
| Funding | Costs | Surplus (Deficit) | |
| Healthcare Enterprise | $3,078M | $3,229M | ($152M) |
| Academic & Research | $1,533M | $1,637M | ($104M) |
| Total Operating Budget | $4,611M | $4,867M | ($255M) |
Note: This reflects the operating budget as of September 2025. This website has been updated as of July 2026.