Data Governance Council 2020-21 Annual Report
September 9, 2021
Overview
Stony Brook’s data governance system was established in fall 2016 in order to improve
Stony Brook’s data infrastructure. The Data Governance Council (DGC) oversees the
data governance system, and began meeting in spring 2017. This is the fourth annual
report of the DGC.
Major accomplishments
-
Reviewed effectiveness of data governance functions and approved a restructured system
-
Extended University data asset inventory to include information about data acquisition, linkages, and access
-
Continued implementation of Data Cookbook as metadata management tool
-
Demonstrated improvement on average maturity of data governance, improving on a 5-point scale from mean of 2.38 in spring 2017 to a mean of 3.39 in spring 2021.
Members 2020-21
Braden Hosch, Chair
Kim Berlin, Co-Chair
Andrei Antonenko
Ahmed Belazi
Diane Bello
David Bousquet
David Cyrille
Robert Davidson
Paula Di Pasquale-Alvarez
Lyle Gomes
Jim Gonzales
Tracey McEachern
Nicholas Prewett
Theresa Diemer, ex officio
Challenges
The COVID-19 pandemic prompted a restructuring (see below) that acknowledges the administrative
function behind data governance, yet this function remains under-resourced with no
positions exclusively devoted to data governance activities. Without at least one
position in place, such as a Data Governance Specialist, the data governance initiative
will be slow to deliver value to the University. Projects that will be slower to implement
are: extension of scope to all university administrative data, comprehensive implementation
of Data Cookbook, development and management of the data asset inventory, the pilot
to begin staged data purging from PeopleSoft, and development of strategy for further
data integration.
Restructuring of Data Governance Council Organization and Scope
Based on a review of operations and challenges from 2019-20 that indicated a need
for clearer lines of reporting and dwindling engagement of the Functional Data Governance
Committees, the DGC proposed a restructuring of the organization of Stony Brook's
data governance system. This restructuring moves away from the David Plotkin model
of data governance adopted by Stanford in the early 2010s that relies on significant
activity in shared working groups of data stewards to a model more centered on administrative
support adopted by the University of Wisconsin-Madison. The revised structure features
- Identifying Executive Sponsors for the DGC
- Division of data stewards into domain data stewards and area data stewards
- Elimination of the Functional Data Governance Committees
- Explicit acknowledgment of an administrative data governance function
- Addition of DGC members to reflect splitting of SVP of Finance and SVP of Administration into separate roles and addition of a designee from VP of Advancement
- Expansion of the scope of data governance from just PeopleSoft and the Data Warehouse to encompass all university administrative data.
Expanded data asset inventory
The university data asset inventory was refreshed in spring 2021 to update initial
information about basic contents, storage location and sensitivity level, and then
extended to collect additional information about data acquisition, data integration,
linkage data access and reporting. Inactive, consolidated, and new data assets were
identified. In all, the University maintained 74 major data assets, as identified
in the inventory at the end of the 2020-21 academic year. Sensitivity levels and storage location distributions
remained relatively unchanged from the initial inventory. Data connection protocols generally
represented a hub and spoke model with PeopleSoft providing one way connections from PS to ancillary
data assets, with limited connection back to PeopleSoft. Almost half (46%) of data assets had no automated
process to push data out, although most (78%) featured some sort of on-board reporting, while
7% were accessed primarily through direct query or ad hoc reports, and 4% were accessed through Tableau.
High-level summary of data asset inventory as of June 2021 (n=74)
|
Sensitivity |
Data Source |
Frequency of |
Data in |
Data out |
||
|
High |
64% |
User input |
62% |
Live |
30% |
12% |
|
Moderate |
23% |
PeopleSoft |
54% |
Multiple times/day |
5% |
3% |
|
Low |
14% |
External Org |
31% |
Daily |
43% |
27% |
|
Other |
16% |
Weekly |
3% |
0% |
||
|
Monthly |
3% |
1% |
||||
|
Locations |
Authentication |
Periodic |
9% |
5% |
||
|
SAAS/Cloud |
59% |
Stony Brook SSO |
62% |
Annually |
7% |
5% |
|
On Premise Server |
54% |
Asset-specific |
32% |
None |
0% |
46% |
|
File share |
9% |
Open access |
4% |
|||
|
Other |
9% |
No info |
1% |
Review and Revision of Definitions in Data Cookbook metadata management tool
The Data Cookbook was acquired at the end of 2017-18. This metadata management tool
provides a repository for data definitions and other metadata that will be integrated
with existing data tools.
Following established naming conventions and standard style, the data governance administrative
team (Berlin, Diemer and Hosch) reviewed content in the tool and standardized according
to accepted standards. This review and revision was two-thirds complete as of the
end of 2020-21. This review represents a small portion of definitions that still need
to be created inside this tool.
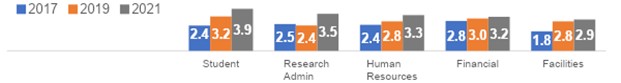
Demonstrated improvement in maturity of data governance
In June 2021, the DGC evaluated the university’s maturity in data governance practices
using a maturity model deployed in spring 2017 and spring 2019. This maturity model
measures practices in communication, culture, organizational structures, data quality,
and roles and responsibilities across five data domains: financial, student/academic,
human resources, research, and facilities. Respondents also had the opportunity to
rate additional domains, but only two responses were received (rankings data and scholarship
metrics data). Maturity was rated on a 5-point scale (1-informal, 2-developing, 3-adopted
& implemented, 4-managed & repeatable, 5-integrated and optimized). Members of the
DGC, data stewards of assets in the university data asset inventory, and selected
university leaders with titles such as Assistant/Associate Vice President/Provost.
Thirty-six responses were received. Overall, maturity improved from the high end of
the “developing” range to solidly within the “adopted & implemented” range. The change
in survey layout and survey population may have contributed to some of increase in
2021; DGC 2021 average response values were about 0.2 below others, suggesting overall
rating could have been closer to 3.2.

|
|
|
|||
|
|
|
|||
|
|
|