Data Governance Council 2018-19 Annual Report
Approved September 12, 2019
Overview
Stony Brook’s data governance system was established in fall 2016 in order to improve
Stony Brook’s data infrastructure. The Data Governance Council (DGC) oversees the
data governance system, and began meeting in spring 2017. This is the second annual
report of the DGC.
Major accomplishments
- Oversaw identification and implementation of 41 projects
- Complete: 6
- In progress: 12
- In queue: 23
- Completed initial data asset inventory of University data assets
- Oversaw initial implementation of Data Cookbook as metadata management tool
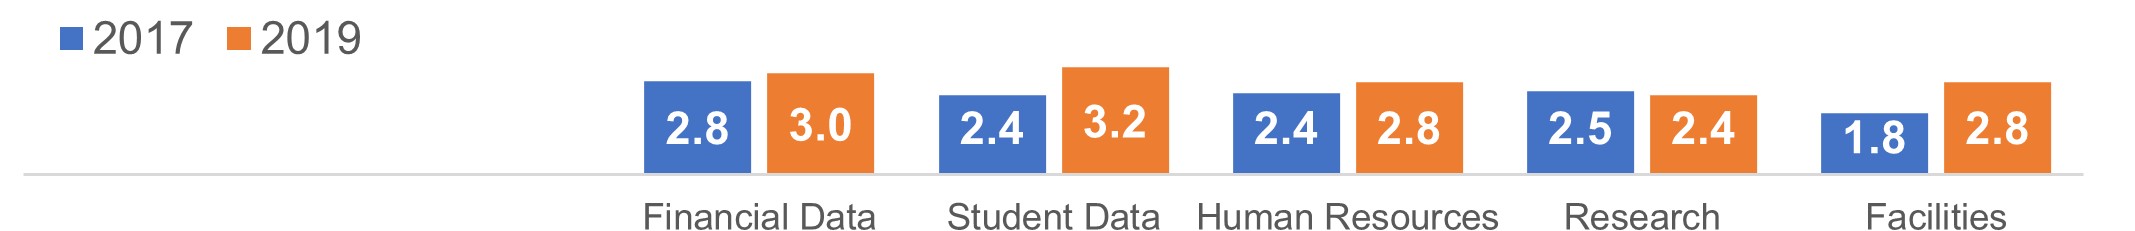
- Demonstrated improvement on average maturity of data governance, improving from mean of 2.38 in spring 2017 to a mean of 2.82 in spring 2019 on a 5-point scale.
Oversaw identification and implementation of 41 projects
The DGC identified 41 projects or issues for attention in 2018-19. Six of these have
been completed, 12 are in progress, and 23 are in the queue for 2019-20. The process
of identifying and prioritizing issues is ongoing. Completed projects include:
Members 2018-19
Braden Hosch, Chair
Kim Berlin, Co-Chair
Ahmed Belazi
Diane Bello
David Cyrille
Robert Davidson
Lyle Gomes
Kate Larsen
Tracey McEachern
Rodney Morrison
Michael Ospitale
Jacqueline Pascariello
Wendy Tang
[Vacant] Univ. Senate designee
Theresa Diemer, ex officio
- Adoption of new academic level codes (U5 and U6) for students pursuing additional baccalaureate degrees
- Resolution of admit types used on East campus to properly code students new to the institution vs. new to East campus.
- Standardization and clean-up of academic plan names and naming conventions
- Adoption of process and coding structure for tracking students who were in the foster care system
- Resolution of item type mismatches between finance and financial aid tables
Completed projects will improve compliance efforts for financial aid distribution,
identification of cohorts for federal graduation rates and outcomes measures, improve
distribution of reports Tableau dashboards, comply with SUNY requirements to report
foster care information, and align reporting between finance and financial aid.
In progress projects are listed below.
|
FDGC |
Project Name |
Category |
|---|---|---|
|
Student |
Citizenship management |
Maintenance Issue |
|
Citizenship and Visa Type inconsistencies |
Data Quality Issue |
|
|
Class section w semantic meaning |
Definition Issue |
|
|
Open Educational Resources (OER) |
Maintenance Issue |
|
|
Residency |
Definition Issue |
|
|
Finance/HR |
Faculty assignment |
Maintenance Issue |
|
Faculty Program Affiliation |
Maintenance Issue |
|
|
Work Location for Employees |
Data Quality Issue |
|
|
Employee Citizenship |
Maintenance Issue |
|
|
Employee Education |
Maintenance Issue |
|
|
Tenure Panel |
Maintenance Issue |
|
|
FSA Employees |
Maintenance Issue |
Completed initial data asset inventory
The DGC extended its efforts to implement the University Data Strategy by creating
an inventory of major university data assets. This inventory includes 80 data assets
principally associated with the University and 161 data assets associated with the
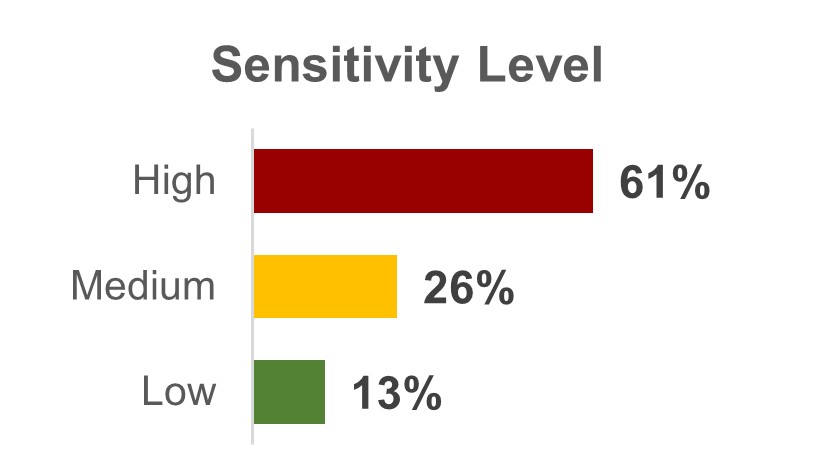
hospital and clinical practice. For the University, the DGC identified responsible
administrators as primary contacts for 77 data assets, gathered a basic description
of contents, identified storage location, and collected a sensitivity level based
on Stony Brook’s P302 Sensitive Information Classification Policy.

For the Hospital, it was determined that advancement of the data asset inventory would
be coordinated in conjunction with update of the Hospital’s recovery plan. Inventories
would be merged subsequently.
Oversaw initial implementation of Data Cookbook metadata management tool
The Data Cookbook was acquired at the end of 2017-18. This metadata management tool
provides a repository for data definitions and other metadata that will be integrated
with existing data tools.
In 2018-19, the technical implementation team configured all administrative components
of Data Cookbook, including alignment with SBU Data Dictionary Standards, workflow
creation, establishing security roles and user permissions for data stewards, integration
with NetID for single sign-on, and configuration of the API for integration with existing
data tools. Content developed includes 75 definitions and 15 specifications. The Data
Cookbooks was demonstrated to the DGC and FDGCs.
In 2019-20, the team will develop best practices, naming conventions and style sheet
for developing definitions; train data stewards on the process to manage data definitions
for their area; create profiles for existing reports and analytics as integration
points for the Data Cookbook; and add the required coding and files to finalize the
report and analytics integration.
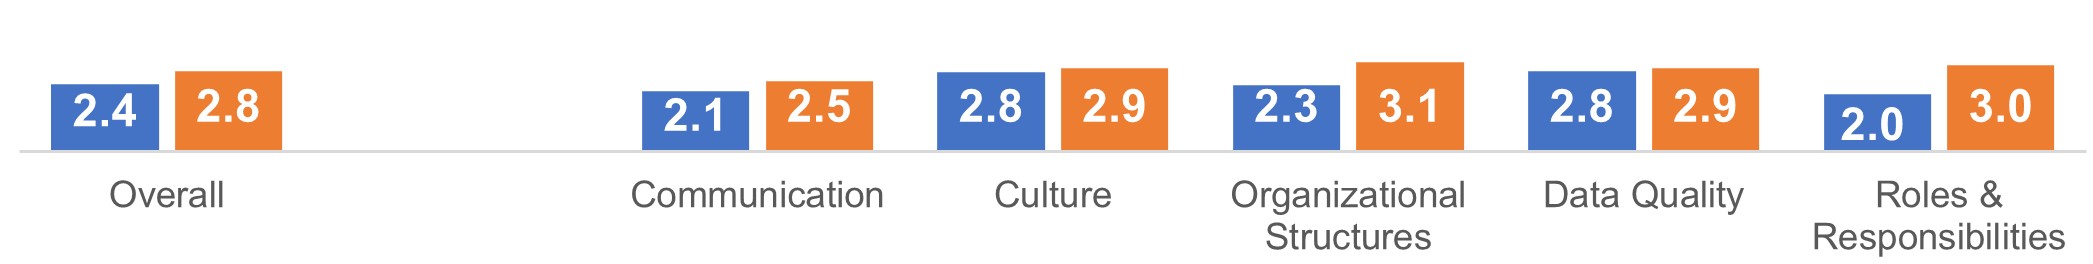
Demonstrated improvement in maturity of data governance
In May 2019, the DGC evaluated the university’s maturity in data governance practices
compared to a baseline measured in spring 2017. This maturity model measures practices
in communication, culture, organizational structures, data quality, and roles and
responsibilities across five data domains: financial, student/academic, human resources,
research, and facilities. Maturity was rated on a 5-point scale (1-informal, 2-developing,
3-adopted & implemented, 4-managed & repeatable, 5-integrated and optimized). Members
of the DGC and the Functional Data Governance Committees were invited to participate;
32 responses were received. Overall, maturity improved from the “developing” range
to the “adopted & implemented” range.
|
|
|
|||
|
|
|
|||
|
|
|