Search this site
×
Search
Search
Office for Research and Innovation
About
Research Contacts
Research and Innovation Leadership
Department Assignments
Career Opportunities
Volunteer
Impact
For Researchers
myResearch
Online Tools for Research
Research Forms
CLEAR-IP
Develop a Proposal
Prepare and Submit a Proposal
Manage Your Sponsored Award
Safeguard Your Research
Ensure Research Compliance
Bring Your Research to Market
For Innovators
Leadership Academy
More
HOME
About
Research Contacts
Research and Innovation Leadership
Department Assignments
Career Opportunities
Volunteer
Impact
For Researchers
myResearch
Online Tools for Research
Research Forms
CLEAR-IP
Develop a Proposal
Prepare and Submit a Proposal
Manage Your Sponsored Award
Safeguard Your Research
Ensure Research Compliance
Bring Your Research to Market
For Innovators
Leadership Academy
More
×
Search
Search
Office for Research and Innovation
Home
About
Research Contacts
Research and Innovation Leadership
Department Assignments
Career Opportunities
Volunteer
Impact
For Researchers
myResearch
Online Tools for Research
Research Forms
CLEAR-IP
Develop a Proposal
Prepare and Submit a Proposal
Manage Your Sponsored Award
Safeguard Your Research
Ensure Research Compliance
Bring Your Research to Market
For Innovators
Leadership Academy
Research Metrics
Expenditures & Proposals
Awards
Inventions/Patents/Licensing
PDF Reports
Instructions on how to print a pdf report
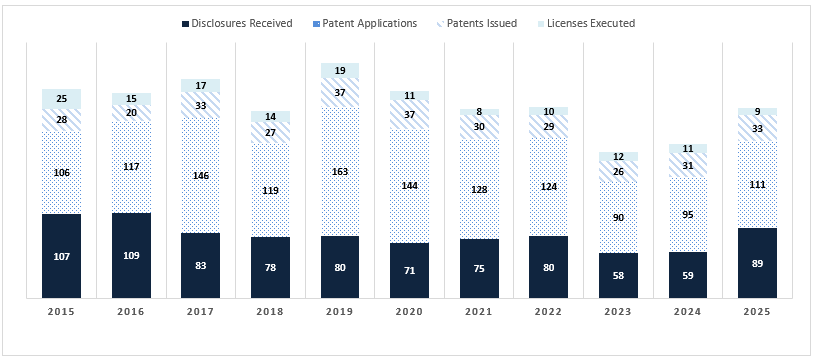
Technology Disclosures, Patents, and Licenses
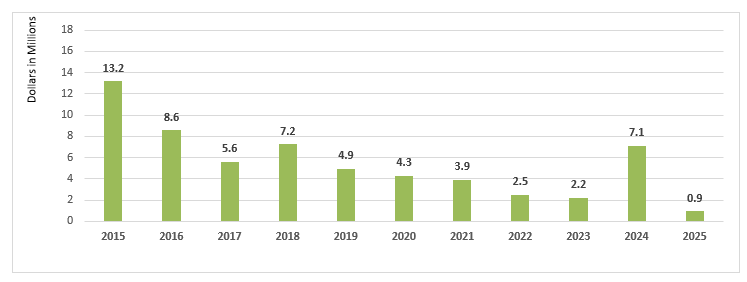
Royalty Incomes
Expenditures
2025
2019
2024
2018
2023
2017
2022
2016
2021
2015
2020
2014
©