14 November 2007
I have not been back to the lab to collect more data, however I have come up with some more ideas. Also, I have finished the plots of the last set I took.
One of the problems I first was first confronted with was whether or not to zoom. If I zoomed, the pixels were a lot larger, and it was simple to see where the range of pixels ended (by tagging values). This made finding the range very easy. However, I repeated the data set without zooming in. In this case, I found the range was much larger. I wondered if this would effect my plots at all. This was my result graphically.

The blue line, which represents NOT zooming in on the image, shows a much more dramatic effect. However, they both demonstrate the same pattern, although at different magnitudes. The effect was overall the same, as the zoomed image was simply a fraction of the total image. However, my conclusion from this bit of curiosity is that I need to use the scion image histogram function. If instead I were to plot the most common value, rather than a rough average, the data would be a lot more sound. This would make me feel MUCH better. Therefore, the next step is to repeat, and move on using scion image to my advantage.
I also tried a little experiment with the gain of the camera. To properly create a light-field, I will need to constuct some sort of light well, however I wanted to see what the gain did. I kept the bias constant and changed the gain in steps of 50. Like the first set I took, I did this for several exposure times. The result is a plot of the average pixel value vs. gain for 1 ms and 1000 ms. I used the same rouch average method as before.
This time, the pink represents the 1000 ms, and the blue the 1 ms. This is expected once again, the exposure time creates a larger effect. However, it is nice to see that the gain clearly changes exponentially. Also, it is affected by the same boundary as the bias. Both curves MUST, eventually end up at 256. However, if the last point is left out, it fits almost perfectly.
The last set of data I took was of the average pixel value vs. the exposure time. This time, the bias was kept constant and just the exposure time was varied. This was repeated for several values of bias around 127. The result was:
It is a little confusing with all the plots on the same axes, however it gives you a good idea of the effect of the bias AND exposure time. The yellow, at the top is a bias of 133, where the red crosses at bottom are 121. I increased the bias in increments of 3. The difference is greater than I expected for such a small increase. I would like to repeat this as well, however finding the true average value with scion image.
9 November 2007
Today I am in the lab for the ITS tour of the LTC. All the students are in WISE, and are taking a look at the rotations they could choose for 187 next sememster.
On another note, I took the time to change my images from floppy (which is useless to me!), to my flash drive. Now I can analyze the images in Scion image, and make some more precise plots. Using scion image, I can use the histogram function to find the max pixel value. This way my plots can be a lot more exact and remove the "ROUGH" aspect.
I also finished the plots of the data from last time, but have not posted them yet. The tour group is here, it will have to wait!
7 November 2007
Today I took some new measurements. This time, I experimented with the gain a little bit. Dr. Noe had suggested that I try a white piece of paper over the camera and try changing the gain. As expected, this did not work so well. The only thing that came out of this measurement was a little more understanding of how the gain works. I got a beautiful exponential plot when I graphed the pixel values againse the gain.
I also took some more measurements comparing the bias to the exposure time. This time, I chose a set bias and changed the exposure time. Dr. Noe suggested logarithmic values, so I took measurements from 1-1000 ms accordingly (1, 2, 5, 10, 20, 50, 100, 200, 500, 1000). Unfortunatly, after 1000 ms, the camera began to lag A LOT. I am going to take some more measurements later on, but as for now I did the quick ones. As they say, patience is a virtue, but unfortunatly a virture I do not posses a lot of.
More graphs are coming soon!!
6 November 2007 (a little later...)
I graphed the average pixel intensity against the bias value of the camera. I only used the camera program to do this, so it is VERY rough. Using the "tag pixels" feature, I found the TOTAL range of pixels. After I found that, I came up with a ROUGH average by finding the median of the full spread of pixel values. I did this for exposure times ranging from 1 ms - 1000 ms, using the same bias values each time. It is a simple concept, but I wanted to see, graphically, how the pixel values depend on the bias as well as the exopsure time.
To get the most dramatic comparasin, I graphed the 1 ms and 1000 ms sets on the same axes.

The Purple set represents the 1000 ms data, and the blue the 1 ms data. It is clear that as exposure time increases, the pixel values increase much faster. The lines through both sets are third order polynomial functions in x. The increase of pixel value due to bias is not linear, as I has envisioned. I suppose a linear relationship does not make sense anyway. At all exposure times, the pixel values still have to end at the same value: 255. I should have pictured an x cubed curve!
6 November 2007
I worked more with the camera today, taking more images and looking at them in Scion Image. It easily makes a histogram of the number of pixels with the same value. The data can also be exported to a .bmp and .txt file. The bmp is a picture of the histogram, while the txt is a list of the y-values. The most common pixel value can easily be pulled from the graph. I was thinking that if I get a good number of these common values from images of different bias, I could make a nice plot. It would be nice to illustrate how the average pixel value changes with the bias.
I took a good number of images with various bias, intending on using the new version of Scion on my laptop to analyze them. However, it was then that I realized I don't have a floppy drive! Great luck. Anyways... I am going to go back into the lab tomorrow between classes and put the images on my memory stick instead of floppy. That way, I can fit a lot more and get a better idea of what is going on.
Additionally, I am going to see what happens with a white paper over the camera instead of black. Dr. Noe suggested this, but didn't expect great results. It is worth a try, use an overly-simplified way to look at a light-field.
1 November 2007
Today there was a group of High school WISE students that came to Stony Brook to tour some of the programs. Dr. Noe conducted a tour of the LTC. 6 students came, and stayed from 2:30 until 6 o'clock. I came in from the begining and stayed until about 4:30, where I spoke to them about WISE, the LTC and college life in general. Dr. Noe then did some of his physics demos with a magnifying glass and a few pairs of glasses. The girls loved the demos, and were really wowed by the way their own glasses work. It was nice to be able to speak to some girls that were in my place just two year ago. I hope we really inspired them!
30 October 2007
Today I went into the lab after classes and we talked about my own project. Dr. Noe and I both had some ideas about what to work on, and together we came up with some fairly simple experiments I could easily do in the lab. They would all be done using the computer camera, under carious conditions.
The first, and simplest experiment I tried was a Dark field analysis. The camera was covered with something black, making the only source of noise overflow of the CCD "wells". A series of images were taken, changing the bias value of the camera from 0-255. The process was repeated for serveral exposure times, with the same bias values. Each time, the range of pixel values was determined by tagging the pixel values. It was determined that as the bias was increased, the pixel intensities increased. Also, when the exposure time was increased, the range of pixel values broadened.
The second experiment would need more than just the camera and a black cover. To analyze a white field image, light would need to be scattered to a large range of angles, before images by the camera. We talked about it, and this could most easily be done using hard, white styrofoam. If we made a circular, hollow structure, it could be lighted through the bottom. This woulc scatter the light coming in from the bottom to a huge array of angles. The light could the be imaged through the side of the structure. Similar analysis techniques of these images would be used, except changing the gain instead of bias of the camera. The same would be done with the exposure time.
The third idea I wanted to try out was to anaylze the amount of noise with change in temperature of the camera. This would ideally be done by cooling AND heaing the ccd element of the camera, however we do not have the technology for the former. Instead, we could simply heat the camera with a light source. We could then analyze a dark field image based on the temperature and exposure time of the camera.
I will work on the dark field analysis first, and think more about how to go about the second and third with the utmost accuracy.
29 October 2007
This weekend and today I have been working on formulating an idea for my own project this semester. I already knew I wanted to work with the new camera, however I wasn't sure exactly how to approach the matter. I told Dr. Noe that since working with Danny on his present project, was interested in an analysis of the noise in the images. After working on the background values of all those pictures for so long... the concept does grow on you!
So Dr. Noe sent me some articles about the subject and I read them. I looked online and found a lot of my own sources as well. I really wanted to understand what the function of the CCD element was and how it recorded the image. Doing so helped me grasp the concept better and led way to some accompanying issues. There are several different types of noise that can be analyzied using a CCD camera. Many have the same general idea, however I would be in need of much more specific equipment. One of the more interesting ideas I came across was Dark Current. The amount of noise in a CCD image increases dramatically with the temperature of the equipment. As the camera heats up just a few degrees (C), the random noise in the image will double. It is an interesting concept, and one I would be interested in experimenting with. Unfortunatly, once again I feel that the equipment needed would be more sophisticated than what we have.
The most common way to analyze the noise in an image is to find the rms value of the pixels and compare different images values. Another common idea was to make a histogram of the values of the background, and get an idea of the contribution of noise.
I am going into the lab tomorrow to work with the camera and start designing this project. I look forward to it, now with better understanding of what I am dealing with.
20 October 2007
Today was homecoming (Wolfstock 2007), and the day to work the LTC table at the expo tent! Dr. Noe, Hamsa and I brought out all out optics toys to the table... and it turned out to be a big hit! Kids loved it! We had a few sitting outside the tent behind us burning paper with a magnifying glass. It was a really good time. We also got access to the giant tent full of food. I think everything I could have possibly imagined was there! It was a great day and a lot of fun for us all.
19 October 2007
Today I went to the lab to Meet Danny. We worked on finding a way to analyze the centroid of the images he took. Dr. Noe already had an idea on how to do this, but we talked it over and came up with a pretty reliable method. First, in quattro we made a spreadsheet and inserted a few functions to caluclate the values we needed. We the imported the data, deleted the centroid area and calculated the average background value. This was all programmed into the spread sheet so all we had to do was copy and paste the data. The data was then reimported (to reinsert the centroid area that was previously removed) and then the centroid values were found. These were also found using the equations we programmed earlier. It was a little tedious, but effective nonetheless and I got almost 20 images done in the next hour. AFter that however, the old pc gave up and it was time to move on to Micrsoft Excel.
Danny set up a similar method in excel and proceeded to finish off the rest of the values that I did not finish. When we were almost done, I made a graph in Excel of the centroid values vs. the position of the camera. The results were not exactly as we had hoped for, however they were something. The y-centroid came out perfectly, as excpected... in a straight line. The x-cetroid plot, however did not seem to change much at all. We looked at this for a while and brainstormed about some new ideas that may have attributed to the problem.
I left shortly after, as it was nearing midnight and we had to get up early for homecoming the next morning. I heard from Dr. Noe the next day that he made some new conclusions and they were on a new track of what to do next.
8 October 2007
On Sunday I went to the lab and met up with Hamsa, Danny and Dr. Noe. We went out to the Curry Club and had a great lunch together. Danny talked to Dr. Noe about the issue he thought of with the experiment. He was concerned about being able to find the center y value of the light. Fortunatly, it did not seem to be an ussue, as it does not really matter if the center is lined up or not.
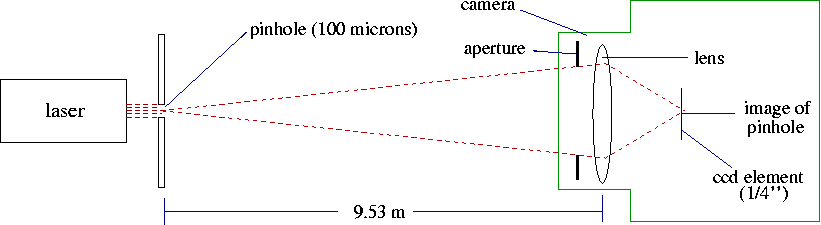
When we got back to the lab we worked on the experiment a little more. I looked at what Hamsa was doing and she explained it to me more. Danny and I then looked at the lenses we had and decided which one to glue to the pinhole. The idea is it stick the pinhole to the camera lens so it can be scanned across the light. This will first be done with a regular light source, and then with an optical vortex. The centroil of the image will be measured using the pizel values from the camera. It will be tedious and require a lot of work, but it will work out well in the end.
Dr. Noe is on vacation for a while now, but he will be back later this week. I will contact Danny soon about that I suppose.... I would like to see what he did after I left. Hopefully we can get together soon and work more. I really enjoyed working with Danny.
20 September 2007
Back at school, another year older. This year, I am taking one credit of research... working on... well I am not sure what yet. That is something we still need to discuss. However, I have read over what one of the summer students has done, and it is very interesting. It has a lot to do with what i worked on last semester, but with a twist. They found a paper someone wrote about analyzing the wavefront of a beam with a Shack-Hartman sensor method. It turns out that whoever did the experiment was not very thorough, and left a lot to the imagination. So Danny is now working on this, and with what seem to be amazing results! I have gotten the idea about it through one meeting with Danny, and numerous e-mails, however I have not had much experience with the physical experiment itself. I look forward to this knowledge.
Over the past year, I have become very interested in modern physics and Einstein's Theory of Relativity. I guess it is becuase I have been taking PHY251/252, however, I have also been reading some Hawking. The ideas are fantastic, and there is so much more to be discovered about it all. I guess I really like the fact that a lot of it is still a mystery, and will be until someone can finally unfold it. Also, I have been thinking a lot about the origin of the universe and how it can be found from astronomy. I am coming to discover that this is the reason I really want to work with astronomy. I want to learn about how the universe works, and hopefully gain some insight on how it all came to be. There is such a beauty in physics, such a wonderful, beauty about how everything is connected and how everything explains something else. It is like a giant puzzle, at times not all the pieces seem to fit... but over time the more knowledge you gain, the more you are able to put together. Let's just say, I want to get to work on this 1,000,000,000,...,000-piece puzzle as soon as I can!
Gee, someone is feeling rather philisophical tonight...
I have just read over my old journal entries and WOW... I was a horrible speller. I like to think that I have changed in that reguard this year. Only a year later though I suppose =). However, I do seem to understand the material I was studying last year a lot more than I did. That feels pretty good. I suppose it has a lot to do with my better understanding of physics now.
I also decided to spice up the colors a bit!
Whoever said change is bad was a liar! =D
23 April 2007
Today is the day before the URECA poster celebration. Kristine and I just got back from our physics lab. I need to install the printer and start working on the poster. Hopefully we can get everything done by tonight. That way we can spend all day tomorrow setting up for the poster celebration. Hopefully we can finish!
22 April 2007
Today I worked a lot on my web report. I got a lot of info on the site, but am not totally done yet. I am thinking it is time to work on the poster now. I have a lot of things put together, but now need to lay them out on the poster and finish. 2 more days until setup!!!
20 April 2007
Today I completed my setup picture. I need to start working on my web report now. As well as that, I need to get things together and make the poster for Wednesday. Things are coming together!
19 April 2007
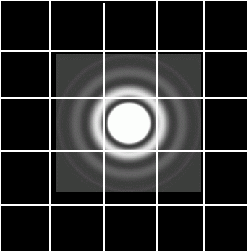
Today I finished my grid and airy pattern picture, and began a picture of my experimental setup. I am making it in xfig.
17 April 2007
Today I worked more on material for my poster. I created a grid in xfig and put an airy pattern on it. It gives a good representation of where the airy pattern is when you look at the psf from the pinhole. We used the Raleigh Criteria and some of Anand's assumptions to find the diffration limit and what we achieved. To further support these assumptions, we looked at the camera as well. We needed to know if the aperature of the lens is changing diameter when a picture is taken. We took a picture in the mirror next to a ruler to find this. Sure enough, the diameter of the aperature was about half. However, this is only when the camera is not zoomed at all. We tried this with the camera zoomed in all the way as well, however it did not work as well. The camera could not be as close to the mirror and still remain focused.
Although we now know that the lens aperature changes in size when a picture is taken unzoomed, we are still not sure about when it is zoomed. We concluded that we were probably taking at picture at 2 times the diffration limit. The airy pattern is about the diameter of 2 pixels. However, if the aperature is also decreased by half when the camera is zoomed, the f number would be 2x's larger. This means the diameter of the airy pattern would be 2x's larger as well. Therefore, depending on the size of the aperature on the camera, we are at 2x's or 4x's the diffration limit.
12 April 2007
Today we went with Dr. Noe to a demonstration of an experiment from 1930. It was being done for an SSO 2 class, but we went in anyways. Using immense voltage, protons were being accelerated into a tube, where they were collided with Litium foil. When they hit the lithium, energy and 2 alpha particles were emmitted. To monitor what was happenening, we looked at a comparasin between the energy of the colliding protons and the number of collisions per 10 seconds. The number of collisions increases exponentially as the energy of the protons is increased. It was really a facinating experiment, and amazing to see repeated from so long ago. Both me and Kristine were shocked when we came around the corner and saw the huge setup and gigantic Van de Graaff Generator in the room. Who would have thought that was what's under the physics building!
When we got back to the lab, we talked more about our posters and what we need to do. We decided against the idea of a graph for the angular size portion of the poster, but decided that a chart is much better. We came up with a good way to create the chart and got started on it. It looks good, and I think will be a very good piece of information for the poster.
In addition to this, we came up with a good way to make the diagram of the experimental setup, as well at to make the airy pattern on a grid. These can be easily made in xfig, and the text edited to make the lines perfect. We made a rought sketch of the grid and airy pattern already, however the lines need to be perfectly spaced and perfectly parallel. I will do this next time I have a chance in the lab. Things are coming together!
10 April 2007
Today we brainstormed for ideas about our posters. We came up with some things we need to put on it, and developed some organization for the stuff. However, mine is a little weird to do. As I do not have a lot of actual data and results, I need to decide which important concepts to present and how to present them. I have started working on some sketches of figures I need to add, as well as some layouts for the poster.
We came up with some ideas on how to present the info about the angular size of a celestial body. We decided it is best to present a good comparasin between the size of the pinhole and some sizes of well-known celestial bodies. There are a few good ways in which we could do this. One, which we investigated today, would be to make a graph of the distance vs diameters. This would make it so the slope of the line is the angular size of the body. I would come up with a few examples of objects and distances that correspond to an angular size of 2.2 arc-seconds (same as the pinhole). Along with this, we would add some objects that have totally different angular sizes, as a basis for comparasin.
9 April 2007
Today I went to see Anand's talk to the ast 200 class. It was very good, and very informative and interesting. He talked about methods used to detect exoplanets. I had heard a little about the matter before, however it was nice to see the data as well as deeper explaination of some of his techniques. He talked about the use of a diffration grating being used with a coronograph to see the center of a star.
29 March 2007
My abstract is finished! Finally! And with no time to spare, since I am going home for spring break in just a few hours. Next I need to work on my poster!
28 March 2007
Today we finally have a plot of our data. I had to use a simple pattern to plot every corner of the plateus in the plot. Tedious. Good word. And once it was done, I had to go back and find out what was making the plot look all funky. Turns out it was becuase of the scaling factor we added, making the minimum intensity value go to zero. It was a fairly simple fix, however tedious. It felt really good to look at the finished product though, and know that I did that. =)
Next I need to work on my abstract... badly. It is in a better state than before, however not finished. Both Dr. Noe and I have drafts, but we need to combine them to make the finished product.
27 March 2007
Today I worked a little more on my abstract, as well as worked on getting more info for it. I looked at some of the things I need to work on with Dr. Noe, and he set me to work.
The camera I was using has a 1/4" ccd element. I looked this up online, as I needed to find what the number meant. I found on a lens site the definitions of all the different sizes of ccd elements. I used this to find the dimensions of one pixel on the camera.
Results? Awesome. The numbers worked out so that the size of each pixel is square with dimensions: 5.625 x 5.625 micrometers.
I also came up with some good comparasins to show how small our point source really was. Looking at the point source is the same as viewing a quarter from 2.2 km (1.36 miles away) or as looking at me from 162 km (>100 miles) away! Thinking about those numbers gives someone a very good perspective about the size we are dealing with.
22 March 2007
We worked on experiments again in the lab today. I tried once more to get the best image I could of the pinhole. However, this time I used a a raw image format, as opposed to the compressed (.jpg) format I used before. We thought that maybe some of the distortion in the image was due to the compression... and could be eliminated using this format instead. Maybe we could get a better image without compressing it? However, this time we ran into some problems and I did not get a good image. It seemed as though the point was much brighter today, and I could not get the camera to focus on the light. I had a suspicion that the brightness was due to a reflection off the face of the laser beam, however changing that did not change the brightness of the point. Instead, I tried to angle the light away from the pinhole, and not get as much of it through the hole. This also did not work as well as I had hoped.
Dr. Noe and I tried to look online for information about the settings on the camera itself. We thought that maybe if we got the appropriate setting, we could get a better image. However, it was unclear as to what all these settings do. So we settled on our own good judgement and I tried again. Maybe is it the image format that caused focusing problems? I am not sure. I guess only more trying will give me the answer.
Today, instead of working more on the image I am begining to work on my abstract. I have gotten about a paragrah done so far, and am still thinking about ideas on what to write. It is not a horribly difficult thing to do, but it is an unnerving thing at least! Back to work....
20 March 2007
Today I went to a colliquium with Dr. Noe instead of working in the lab. It was a presentation by Professor Deane Peterson, about the rotation of stars...especially Vega. Although his descriptions and presentation were a little deep for me, I was still not as lost as I thought I would be. At least his data meant something to me! In in the end, it was very interesting data and supported much of the past info he also showed us. Overall... was a good talk!
16 March 2007
Although we did not have class today, both Kristine and I came into the lab to work. We stayed for a few hours and got a lot more done than we ever had. We really started working on our individual projects. While Kristine continued to work with the laser and polarizer setup, I moved to another setup to create a point source.
Using a laser propped on books, a pinhole and the length of the room... I created a point source. Using the Sony Mavica camera, I took a picture of the pinhole from across the room. Once on the computer, the picture was cropped and blown up, so we could see the individual pixels in the dot. This is the makings of a point source function. In order to get the best accuracy, the point source should be as small as possible on the camera. After a few tries, I got an image that seemed to be concentrated in one pixel... exactly what we were trying to get.
Once this perfect dot was created, we used the small-angle-approximation(warning...pdf) to find it's angular size in arc-seconds. This is used very often by astronomers dealing with celestial bodies.
Next time, we will try different formats for the image... to see if it will yield a better resolved image of the point. Also, I am going to try to use different size pinholes, and see what types of images I can get.
15 March 2007
Today we looked at the previous experiment a little more. We finished taking data where we had left off, and graphed the rest of the data. Even though we had taken a break in between the data-taking, the numbers still fit perfectly on the curve. It was amazing to see.
When we finished taking data and graphing, we decided to see why the second peak on the graph was so much lower. We assumed it was probably due to a fingerprint or smudge on the polarizer. Sure enough, there was a cloudy spot on one side of the polarizer. Moral of the story folks... Don't touch the optics!
13 March 2007
We collected more data for our small experiment today. This time, we took readings every 2 degrees. Very tedious, but very precise! We did not finish, but when we graphed the data we did have, it lined up almost perfectly with the expected curve. However, there was one difference. When the second maximum was approached, the peak occurred significantly lower than it should have. This was very strange as it was a very smooth curve, not an error in data. It was decided that this must have something to do with the polarizer. There could very well be a deformity in the polarizer, that caused less light to get through it.
In addition to this, we looked at a possibility to test the batteries in the meter. Using a resistor, we could see how much of the voltage is drained by the laser over time. This would be an interesting side experiment to look at all aspects of this test.
We will be going back into the lab soon to finish taking data, and to finish graphing and examining the polarizer. I am very anxious to see what will happen when we finish taking data and what the graph looks like. As well as this, I am anxious to look at the airy pattern again, and see if I can get the pattern enhanced.
8 March 2007
Today Kristine and I got to use the most expensive Tinker Toys set I have ever seen! We used a setup with a linearly polarized laser and a polarizer on a turner. Using a detector after the polarizer, we measured the current of the laser at different angles of the polarizer. However, we ran into a few problems. It seemed as though the laser was not stable in its output. We kept getting fluctuation readings with the meter. When we had tested the laser a few minutes earlier, the max current had been ~3.9 mA, however later it was only ~2.6 mA! Crazy huh. We decided that the laser was not to be trusted, nor was the meter to do this experiment. Therefore, we could never get very accurate results with this setup. We would need to test the lasers behavior, as well as change the batteries in the meter. Dr. Noe mentioned this may have been the problem with the meter. Regardless of these problems, in the end we got respectable results that showed the predicted graph of intensity. It is a very beautiful picture, which we hope to graph on gnuplot, rather than just by hand. Also, we hope to gather more data in the week to come, and spend more time working in the lab. In addition to this experiment, we tried something with Airy disks. We hypothesized that if we were to block out the center dot in the pattern, we would see more disks. However, to do this, we would either need to make the spot true black, or make a hole in the paper. As the latter is much more feasible, we tried it. Unfortunately, with the hasty experiment we did, there were NOT more rings. However, I would like to try this experiment again, with more time this week. Hope for better results!7 March 2007
Today I went to lunch with Dr. Noe, Anand and Azure. We talked about some of Anand's work and projects. Some of the things he had to say and brought were fascinating. He showed us some thick, black pages on which there were small slits. He explained he used these to look at individual stars/point sources in a galaxy. It is amazing to think he was able to make the slits align with the galaxy. The precision that must take, program or not. When we got back to the lab, we looked at the setup I will be using soon to make some measurements. We showed Anand and Azure the phenomenon that occurs when you turn the grating. They were both amazing and baffled as to how it may happen. Something that makes me even more keen to know what is happening! Quite a conundrum I guess!6 March 2007
We looked at Young's Double Slit Experiment, and the theory behind it. I looked at a few pictures of what happens, and derived the diffraction equation. It was easy to see what was happening once the pictures were clear and I saw the equation. We got out a diffraction grating and made a simple setup on the table. We placed the grating in a stand, and held a screen behind it. A green laser was then shone through the grating onto the screen. When the light went through the grating, it was separated into orders. The first being closest to the center, and the successive orders farther out. We talked about what I need to do with the setup to learn about diffraction. I will come in some time during the week, or during a class period to measure the angles of the diffracted orders. This will lead up to my project, which concepts will probably be closely related to this small exercise.
Also, when we were looking at the diffraction grating and laser, we discovered quite and interesting phenomenon. When the grating is kept stationary, but the turned a very small amount, the spots move very strangely! When it is turned to the left, the right 1st order spot moves a large distance to the right. Similarly, when it is moved to the right, the same thing happens to the left spot. However, the one on the corresponding side to the movement moves very little! Strange! I really am curious to know what causes that to happen. Although Dr. Noe mentioned it was probably a simple math problem, i still want to know why!!
1 March 2007
We started class by talking a lot about working on our webpages. I needed help with a few things so I could really start working hardcore on my site. I was confused about how to move things and rename them. That was easy enough once I got that squared away. Dr. Noe gave us some useful codes, and he lent me out some books to look over about Linux. It has been very helpful and I have learned a lot. Azure's website has a fantastic list of commonly used debian Linux codes which has also proved to be quite useful. Also, we got the mother of all lists... for using emacs. That thing is 2 pages long with 8pt font! Esh... looked it over a bit though and experimented with it a bit. I think I am getting the hang of emacs, but I need to work on it more still...Also, we looked at the directory file tree in Linux/webpages. It was nice to see it made out for me... It makes sense now! Looking at it helped me a lot with seeing how to set up my file system. I figure lots of subdirectories = lots of organization! Which is always good in my book!
Once again we delved into the topic of our interests and project ideas. Kristine brought up hers and we learned a lot about light as an electromagnetic wave and its applications. We looked at some of the basic E&M formulas that can be used to find forces in fields. This was after we identified WHAT an electric field and magnetic field are. After we discussed fields a bit, Dr. Noe brought up Maxwell's Equations and how they were used to determine the speed of light. Pretty neat stuff! All this stuff however culminated in a discussion about polarized light... Kristine's most likely topic for research. We talked about the very basics... What is polarized light? It's a really good question... since I am not quite sure myself. I never really got a basic introduction to what it is! Anyways... that became much clearer when Dr. Noe did some examples of light being shone through multiple polarizers at different angles. We then calculated what the intensity and magnitude the light would be after polarization. We used fairly simple equations to figure this out, and afterward investigated what the graph looked like. We also learned that when light is polarized, it is only the electric field component that is considered.
Right before it was time to leave, we quickly looked at a famous problem related to this type of math. It is the problem where you need to optimize the area of a garden with a constraint on the length of fencing you have. You need to use the information about the perimeter to find the dimensions of the field that will make the largest area. To make a long story short... in the end the ideal dimensions are a square! This is related to the satanistic problem from precalculus where u have to make the garden NEXT TO a river. This means one side dosen't have to be fenced in. However, in this problem the optimal area is NOT a square like in the previous... it is also slightly harder to solve.
28 February 2007
Worked a lot on research today. I was in mentoring for 3 hours and ran out of work, so i figured I would do some surfing for some good info =P. I found an awesome site... totally unhelpful in the search for a project, but facinating nonetheless. It shows what it happening in the sky all week. Some of it... well, a good portion can be seen without a telescope. Awesome for someone in college with a telescope at home!!!Also... I wanted to look up arc-second. It is something I heard about a little in class, but also came up a lot in stuff i'm reading. It is finally time for me to understand what it really is!
27 February 2007
Today I went to the colloquium with Dr. Noe and Azure. It was a talk by Marusa Bradac, female astronomer about dark matter. She was a very good speaker and presented her data very well... keeping my interest the whole time. After the talk I went back down the the lab and waited for everyone to come back. Marusa came down and spent at least an hour looking around the lab. It was facinating to hear about her father, who is trying to spawn better teaching of physics in Slovenia. When he heard this, Dr. Noe pulled out all his fun, simple optics toys and wowed Marusa. Happened to me the first day in the lab too! It all made me really want to be an astronomer... here goes. I am looking into changing my major now. It seems so sudden that I have finally decided to do it.. but I think it is what I really want. =)I learned how to work on my website remotely today. I had tried to do it before, but I got myself confused and didn't accomplish anything. However, today I was helping Christina in the lab, and I just sort of figured it out. I love when things happen like that. It's amazing! Anyways... when I got back to my room I started and got on a roll! I pulled out the html I knew already and started making things interesting. I love doing it... it's so much fun. Also, as i was adding links to my journal, I got to read a lot of interesting things. I didn't get to read them all, but I bookmarked a lot of things for later. Seeing as its past midnight now... that may have to be saved for tomorrow =/. That's work for tomorrow I have decided...
One more before I fall asleep on the keyboard! It covers the topic better... The Search for Dark Matter
Also, apparantly the talk from today took off in the scientific community! Just got this link from Dr. Noe... Hubble News
23 February 2007
We talked a lot about listing ideas for potential projects. I am going to work on a page to list ideas and terms to look up. We looked into spectroscopy as a potential topic for research. Dr. Noe brought up a few modetn applications of spectroscopy in physics and astronomy. Discussed stellar spectroscopy. THis method can be used to determine the spectrum of a star. Also... talked A LOT about point spread functions...apparantly they are very important in science...Adaptive optics is another idea to look into for a topic. It is the method by which atmospheric disturbances can be compensated in astronomy. This is done by bending the secondary mirror in a telescope.
A facinating lead on a project involves spectroscopy with an ordinary camera and a diffraction grating. The resolution of this image would depend on the resolution of the camera used to take the picture. However, the light hitting the diffraction grating is not all parallel. This can be fixed using something such as a lens. This is called collimating the light. However, there is another problem. When the light passes through the diffraction grating, it is bent at an angle. This can be compensated by using a prism. The unique combination of the two is called a grism. This device uses a lens and a prism to defract the light in a straight line. Could this principle be used to take the image of the spectrum of a star through a camera?
15 February 2007
We discussed more about ray and wave optics. We explored total internal reflection and the crititcal angle. This is a phenomenon that occurs when light travels from a medium with a higher n to a medium with a lower n. However, it only occurs at a special angle in which light is not refracted anymore. Instead, the light is totally reflected. This angle is called the critical angle.This is related to the way a slab waveguide works. A slab waveguide is a method using the principle of total internal reflection to "trap" light in a thin layer of polymer.
We also investigated Brewster's Angle. This is the angle at which light is totally polarized when it is reflected. If light is already polarized and is reflected at the Brewster angle, will there be a reflection?
The Brewster angle can be used to measure the index of refraction of a material. How? We also explored the uses of the Brewster angle in lasers. What?
Dr. Noe mentioned something called an Airy disk, and demonstrated it using a weak laser. This pattern appears as 2 circles, with a haze around them. Usually, the circles overlap as do the circlular hazes of the dots. This is a phenomenon associated with telescopes.
13 February 2007
Today we looked at the different properties of light and how they can be studied. We looked at some of the different aspects of wave and ray optics. Corresponding to these aspects, we listed some of the properties of light...Fermat's Principle is used in optics to determine the path light will take. The principle is stated: light will take the path that will take the shortest time to travel. How does light know this way? It really dosen't... It is in fact a matter of constructive interference and destructive interference. Light comes from all directions and all different angles...however due to destructive interference it is cancelled out. This is the complex explaination of the principle... which we only touched upon. A WISE summer student worked on a prject involoving this in 2006. Her slide show is a fantastic demonstration about Fermat's Principle. It covers the basics of the principle, as well as showing some very good proofs and examples.
We looked at how this principle applies to reflection as well as refraction. I brough up Snell's Law, which Dr. Noe then made big connections to. If light has to move through 2 different mediums, one with a higher index of refraction than the other... it wil travel farther through the latter and take the shortest possible path through the former. This makes sense, and also works with Fermat's Principle. In doing so, the light will make the trip in the shortest amount of time.
In addition to ray optics, we touched on the properties of wave optics. This included Young's Double Slit experiment. This experiment demonstrates the wave nature of light, and shows the effects of constructive and destructive interference.
We finished the discussion with more about polarization and light as an electromagnetic wave. We looked at some polarizers and discussed how certain phenomena occur. Dr. Noe illustrated what happens when light is polarized... he made that idea much clearer than it had been before.
8 February 2007
Today we talked about polarizing light. We discovered that light from a laser can be polarized. We also looked at a red and green laser and how they are affected when they pass through skin. The red was much more visible through the soft tissue, whereas the green laser only shone through because of its intensity.We looked at a program used to diagram light rays. Dr. Noe showed us how he and a student used the program to disprove a theory about the pig toy. This is a toy of sorts that a former WISE187 student, Sriya. A scientist had mathematically proved the existence of another image of the pig, with the top 3 times the distance away. However, he proved the existence based on the assumption that the mirrors were sphereical, rather then parabolic. He also claimed to have seen the image, which was prooved to be impossible! Quite an interesting discovery.
We also learned about how to write an effective journal entry and looked at some good examples. We looked a little more at HTML and website designing using Linux. Linux is so much fun and such a good experience to use. I had it on my personal computer for a while a few months ago... but it is amazing how ignorant you feel in front of an empty terminal window. It seems as if everything important just leaked out of my head in a few months! Oh well.. time to start over and learn it again. It is different after all.. I have never used debian before... just Ubuntu. Either way... theres still Tux!!! =)
| Marissa MacDonald February 2007 Home |
Laser Teaching Center |