Measuring the Wavelength of
Laser Light with an Ordinary Ruler
Amara Tazeem
WISE 187 Course
Stony Brook University
May 2003
Introduction
Light and its characteristics have baffled physicists for
centuries. The question: is light a steady stream of particles or is
it a wave that spreads from a source, was not completely answered
until the early 20th century.The debate finally ended with the
realization that light has both wave and particle properties. By
1830, most scientists had accepted the wave theory of light. It was
not until 1905, when Einstein showed that light emits energy in
packets or quanta, that the scientific community accepted the particle
theory of light.
In this experiment the traditional wave theory of light and including
its predictions about diffraction and interference were studied. The
data gathered was used to calculate the wavelength of a beam of red
laser light.
Diffraction is characteristic of the wave nature of light. It occurs when
light comes across an obstacle in its path. The wave theory of light
predicts that the light bends around the object in its path, into the
region behind it, called the shadow region. As the light waves of light
bend around the object, they cross each others path, hence interfering
with one another.
There are two types of interference that can occur. Waves can interfere
constructively or destructively. In constructive interference the crest or
maximum of one wave interferes with the crest of a second wave producing a
bright spot. This occurs when the waves are in phase with one
another. This pattern is produced for an integer multiple of the
wavelength of light used. The formula for this is d sin  = m = m  . If the crest of one wave interferes with the
trough or minimum of a second wave the maximum and minimum cancel to give
a dark spot. This is referred to as destructive interference. This occurs
when the wave fronts are 180o out of phase with one another so that they
differ by a factor of ˝. The formula for this is given by
d sin = (1/2 +m).
This is shown in the diagram below (taken from Ref. 2). . If the crest of one wave interferes with the
trough or minimum of a second wave the maximum and minimum cancel to give
a dark spot. This is referred to as destructive interference. This occurs
when the wave fronts are 180o out of phase with one another so that they
differ by a factor of ˝. The formula for this is given by
d sin = (1/2 +m).
This is shown in the diagram below (taken from Ref. 2).
The type of interference pattern observed depends on the wavelength of
light used. In order to observe an interference pattern at all, the light
used must by coherent. Lights emitted from coherent sources have a
specific phase relationship relative to one another. That is, the light
waves could be fully in phase, fully out of phase, partially in phase or
partially out of phase. What matters is that the waves have a specific
orientation relative to one another. It has to be directed a certain way
so that the waves from the two sources, or from a single source, can
continuously interfere with one another. If the sources aren't coherent and
the waves generated are in random phases relative to one another, no
pattern is produced, and a fully illuminated projection screen will be
seen.
The first full coherent source of light, the Light Amplification by
Stimulated Emission of Radiation (laser), was not developed until the
1950s. It is this relatively new technology that was used in this
experiment to produce an interference pattern.
One final important point with regard to this experiment is that visible
light comes in a whole array of colors from violet at one end with a
wavelength of 500 nm to red at the other end with a wavelength of 700
nm. Because interference patterns are sensitive to the wavelength of
light, using "white" light, which consists of light with various
wavelengths, could be a problem. Hence it is essential to isolate the
different bands of light to get a source that is monochromatic, of one
wavelength. In this experiment monochromatic red coherent laser light was
used.
Procedure
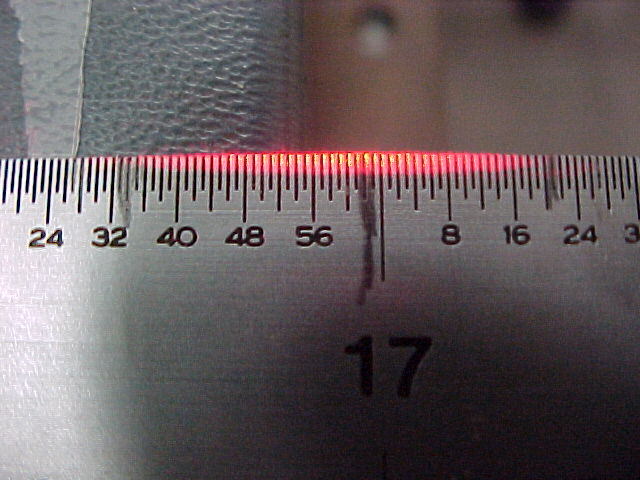
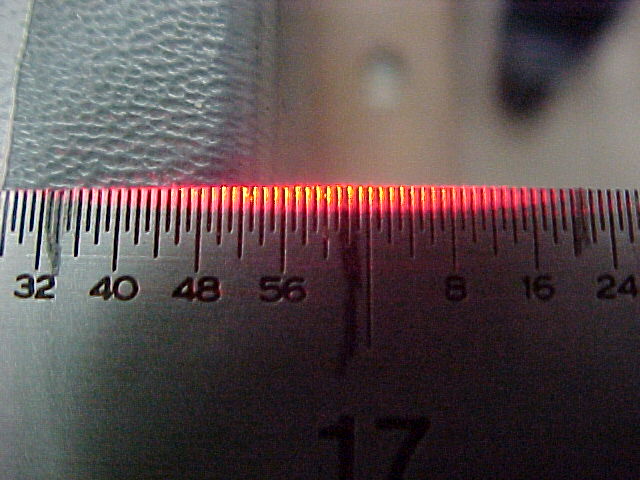
A Helium Neon laser was used to emit red laser light. A beam of light
was directed at the edge of a machinist ruler with 100 divisions to an
inch, for the first group of data. The divisions were etched into the
surface of the ruler, allowing them to be used as "reflection
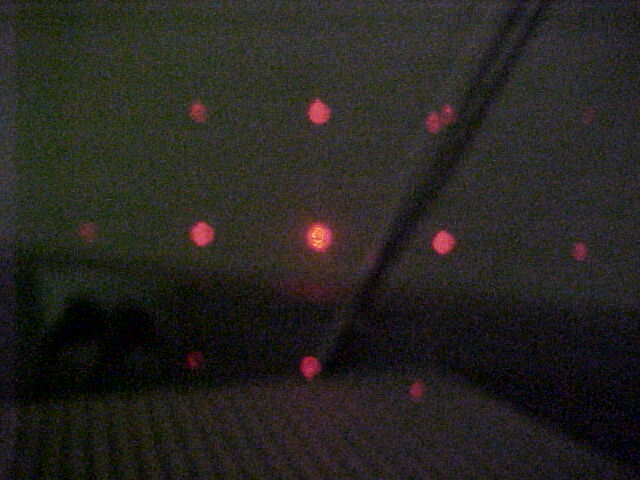
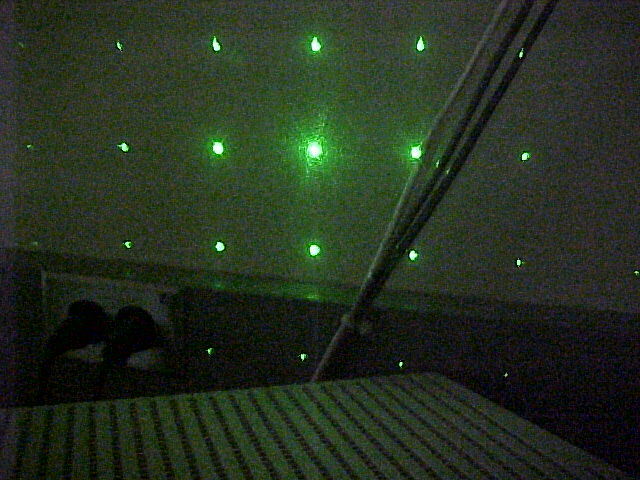
gratings." to create diffraction patterns. The pattern of spots was
observed on the opposite wall. it was traced onto aced onto a piece of
graph paper to be analyzed later. It was noted that the intensity of
the spots decreased as their distance from the first spot increased.
The ruler was then flipped so that the grating size was increased from
100 to an inch to 64 to an inch. The interference pattern produced
here was also traced. The previous mentioned calculations were
conducted while the angle at which the laser beam hit the ruler was
kept the same. In order to understand what effect varying the angle
had in the pattern produced, for the next set of data, it was varied
and the same two ruler gratings were used.The last two patterns were
observed as the beam hit the ruler at the same angle to the
horizontal.
Data
For Theta 1
As can be seen from the pictures above, the distance to the wall was
calculated from the position of maximum brightness of the laser beam
on the ruler. This distance is L = 74.4 +/- 0.2 cm for this set of
data.
The graphs below exactly reproduce the diffraction patterns that were
observed for angle 1 using the 100 divisions to an inch and the 64
divisions to an inch gratings. The numbers recorded next to each spot
tell the distance of that spot from the first spot, which the image of
the beam as directly misses the ruler.
For Theta 2
Distance to the wall from position of maximum brightness on ruler = L
= 69 +/- 0.2 cm
Analysis
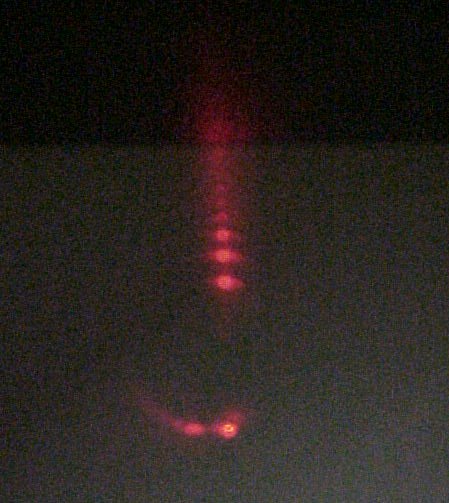
The lowest spot in the interference patterns shown above is that of
the beam of light as grazes the edge of the ruler. The second lowest
spot in the pattern above is from light being reflected without
diffraction. This is called the zeroth order of diffraction, even
though no diffraction is actually ocurring. The one above it is the
first order, and so on. The origin is taken as the position directly
between the spot that goes straight past the ruler and the zeroth
order spot. This is illustrated in the figure below (see ref. 1).
Using the distance from the origin to the zeroth order spot, as x, and the
distance to the wall, d, the angle between the horizontal and the zeroth
order spot was calculated. This angle should be the same for the 100 marks
per division grating and the 64 marks per division.
The data above shows the angle calculated using tan
= (x/d). A small variation in the angles can be seen
when they were supposed to be the same. The difference is relatively
small and thus is not significant to the results of this
experiment. Also this is to be expected because the instruments used
are not highly precise.
When searching for a formula that related all the data gathered to the
wavelength of light , an incorrect formula was
found on one web site from the University of Melbourne Physics
Department instructional labs (see Ref. 3).
The formula defined x as the distance to the wall, y as
the vertical distance to the spot, from the origin, and d as
the distance between the markings on the ruler. The formula given is
as follows:
This formula can be shown as incorrect by a simple dimensional
analysis. On the left side n has no units and
is a length. On the right side x, y
and d are also units of length. So
[L] = [L][L3/L2]
 [L] = [L][L]
[L] = [L2]
[L] = [L][L]
[L] = [L2]
This is obviously wrong since a quantity with units of length can't
equal a quantity with units of length squared. The correct formula
should have units of [L2] in the numerator as well as the
denominator. The correct formula is stated in A.L. Schawlow's 1965
paper on measuring the wavelength of light using a ruler (see Ref. 4).
The formula used in this experiment to calculate
the wavelength of the laser light is slightly different than Schawlow's.
The derivation of the formula, shown below, starts with the Bragg equation,
and then uses a small-angle approximation.
The final equation gained from the derivation above resembles a regular linear equation of the form y = Ax + B.
In the above, 2 is the y variable, the expression 2[(1 - cos 1)] is the B term, and the slope is 2/d, where d is the spacing of the ruler markings, and m is the diffraction order. The equation has been plotted in the graph below.
The above graphs are plotted as diffraction order vs. the angle
squared. Here the angle is in degrees. These graphs were made for the
100 divisions per inch data that was gathered for the two different
angles. The linear relationship proved above is clearly visible. Also
it can be seen that the lines obtained for the two different angles
are approximately parallel.This is also expected from the formula
above since d, and are the same for both, and
the only difference between the two sets of data is the incident angle
of the laser beam with the ruler. This is only present in the B term in the
equation and hence serves to only shift the two lines relative to one
another.
Calculation of the Wavelength of light
References
1.
Measuring the wavelength of light
2. Interference
3.
MEASUREMENT OF THE WAVELENGTH OF LIGHT USING A RULER
4. A. L. Schawlow, "Measuring the Wavelength of Light with a Ruler," 33
(11), 922-923 (1965)
5. Giancoli, Douglas C. Physics. Upper Saddle River: Prentice Hall, 2000.
6. http://www.math.luc.edu/gifs/arrows.html
|