Research Journal
Thursday, December 13, 2012
We worked on the second and third part of my report today. John edited the reference part for me. He sent me many interesting papers about rainbow. It turned out that many people had attempted to explain the rainbow effect before Descartes. Although the reflection model of rainbow is called Descartes's model, he didn't propose the whole theory. It seems like he was right about the 42 degrees, which is the concentration angle of the rainbow. People figured out the explanation of that angle after him. John also taught me how to add a tag on the webpage so that we can add link to a specific position on the page. This trick is quite useful. Now it is going to be the end of my exchange life in Stony Brook University. Well, time flies. This semester was really tiring, but rewarding. I took the courses here in SBU, while I still worked on the courses in my home university. It was nice to meet all the people here and I really enjoy this project. I have learned so many things in those four months. Those achievements are not only limited in my language ability. I learned how to use Latex and I even learned how to edit a webpage. I have my own webpage now! SBU has given me much more than I expected before I came here.
Wednesday, December 12, 2012
Today, John helped me revise my recent research journals and then we wrote them into my report. John also edited the pictures he took in this project with Picasa. It was so nice to recall all the fun moments by looking at those pictures. This is indeed a fruitful semester. We arranged those photos in the sequence of events and put them in the picture section of my webpage. Those pictures form a whole story showing what we have done in this project. Neither of us knew how this project would go at first. We did it just because I said that I was interested in rainbow. However, it turned out that we really discovered something new. This is really a happy and surprising ending. We decided to finish the whole report tomorrow and revise it on Friday.
Wednesday, December 5, 2012
We started writing the report of my project today. John helped me re-write the introduction by carefully re-arranging every sentence of my original draft. We also found some new characteristics of the laser rainbow effect that we discovered recently. In particular, the outermost radius of the bright ring on the screen is not formed by rays from any specific angle. When the screen is placed in different positions, the rays that form the outer edge of the ring actually come from different angles. Therefore, the angle (from the optical axis) of the emergent light that forms the outer edge of the ring is not a constant. This effect is quite clear close to the sphere (in the near-field), but this angle is almost a constant when the screen is in the far-field. From the schematic ray-trace figure I plotted (the real one with accurate angles), it was clear that the rays that form the outer edge of the ring on the screen actually join with each other to form a caustic! The envelope has a shape similar to that of an expanding Gaussian beam. It is amazing! We will do some further numerical simulations to compare with the data we obtained last week.
Wednesday, November 28, 2012
Today we carried out some careful measurements of the diameter of the outer edge of the ring at different distances between the screen and the sphere. At each distance we marked the two opposite outer edges of the ring on a foam-board screen with a small hole in it. We were careful to set the screen perpendicular to the table top. Before making the measurements, we carefully adjusted the setup to make sure that the laser beam went through the center of the sphere. We tilted the laser to make the laser beam parallel to the table and adjusted the height of the sphere until the spots of reflected light from its front and back surfaces overlapped each other on the screen. We observed unexpected interference fringes when the two spots were overlapped. The data we obtained appear to be highly linear, which means that the angle of the outer edge of the ring and the table is a constant. If we use this obtained angle (which was about 11 degrees) as the maximum angle, we can deduce the refractive index of the sphere, with the result n = 1.51. The sphere is actually made of glass not plastic! This graph shows our data with a straight line fit.
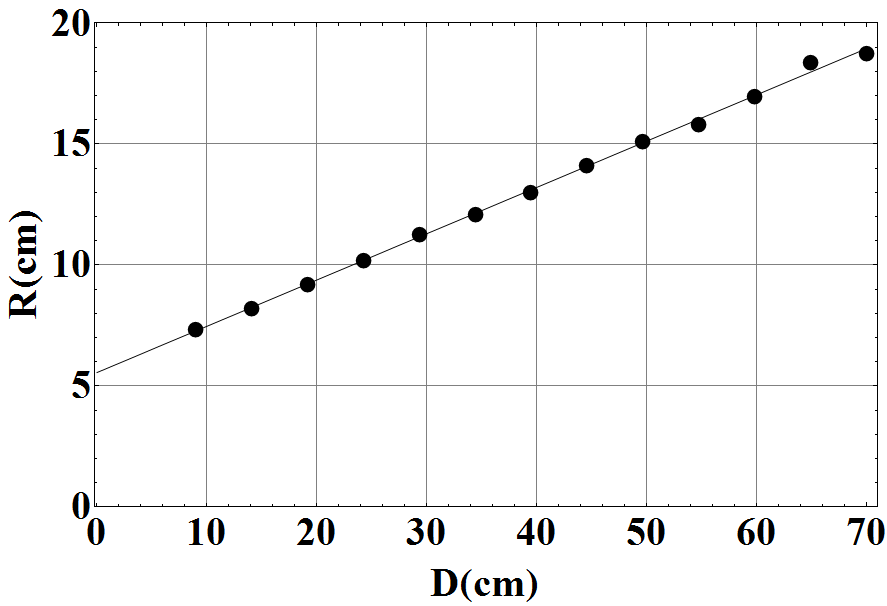
However, I later realized that this is not the whole story. Light from the maximum angle does not necessarily form the outer edge of the ring. The concentration we saw with our eyes is due to the limit of maximum radius, but not the limit of maximum angle in this system. It turns out that the condition of the maximum radius is closely related to the position of the screen. Our explanation of the "laser rainbow" may not be complete, since we only took the maximum angle into account. The peak of the radius with respect to the reflective angle actually shifted when we moved the screen back and forth, which means the angle of the outer-most light is not the maximum angle.
Wednesday, November 14, 2012
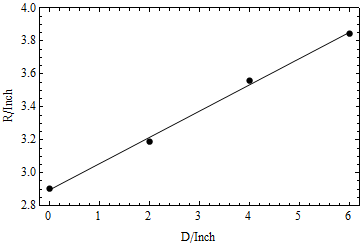
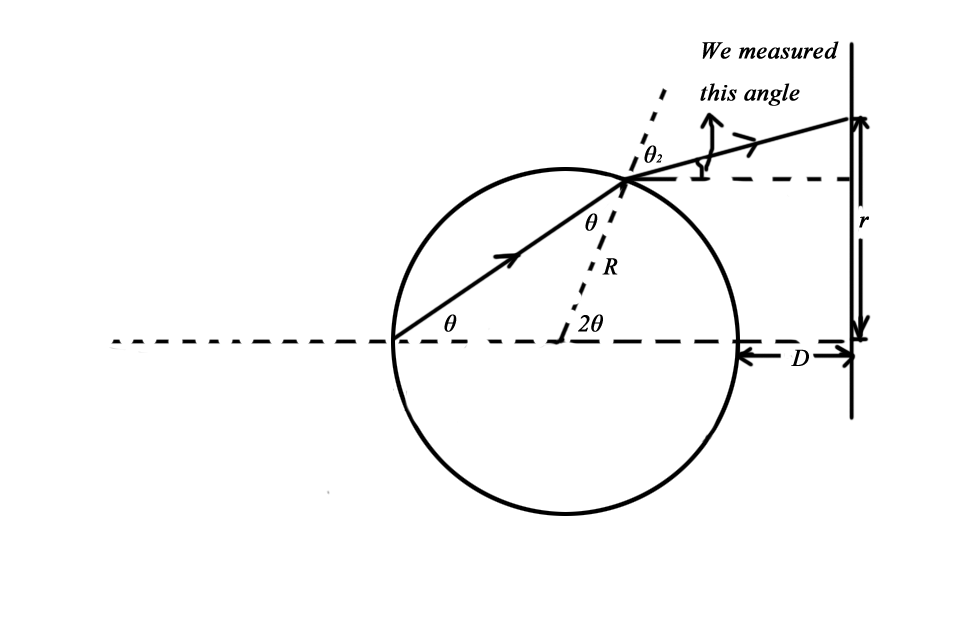
John discussed the report with me. We decided to divide the report into 4 main parts. They are introduction, mathematical simulation of rainbow, simulation of rainbow in reality and the related concentration phenomenon. We measured the diameter and the weight of the sphere we used to do the simulation. The density of the sphere is about 3.1g/cm^3. We had a really hard time to decide what the material of this sphere is, which is closely related to the refractive index. However, we did not make much progress today. We also decided to do some measurement in the concentration phenomenon we discovered few weeks ago. It is possible for us to make quite accurate measurement of the angle between the emergent light and the outgoing light. We can do this by simply measuring the change of the radius of the disk on the screen with respect to a change in the position of the screen. The relationship of them should be linear and the slop is the angle we want. We tried to do some crude measurement today. The result is shown below. The angle is about 9.1 degrees and the predicted value with n=1.5 is 10 degrees. They are quite close to each other. However, I first made a mistake in the calculating, which made both of us quite confused of the sphere. When the problem solved, the result is just good.
Wednesday, 25 October 2012
John discussed things we should do in the following month. We will work on the report of this project about the concentration phenomenon in the next month. It's time for me to organize all the materials I have obtained in this semester. I should first write an outline of the essay and decide the pictures I will use in the report. And some figures are not good enough to illustrate all the ideas of the concentration phenomenon, which should be redrawn in detail. We should take some photos of the experimental phenomenon. John required me to write a to-do list to remind me what I should do. He also showed something about the optical phenomenon of the stream. The surface of the water can cause the concentration of the light, which account for the bright pattern we often see on the surface of water. Berry had done lots of work on this phenomenon, which is rather complicated. He also told me something about the Umbilic Torus sculpture in front of the physics building.
Wednesday, 26 September 2012
John pointed out that my way of doing the correction of the model is not right. I only considered one point in the sun. Since the sun has an angular size of about 1 degree. The light coming from the sun should be treated as light coming from half of a sphere. That is to say. My result must be integrated in the sphere, which is not easier done. On the other hand, my correction is trivial compared to the distance between the sun and the raindrop. We wanted to measure the refractive index of the crystal ball. A possible way might be measuring the intensity ratio between the incident light and the reflective light on the surface of the sphere. We used a concave lens to focus the laser beam, so that the emergent light would not be divergent. The photo detector will work better in this situation. However, the result was about 1.41, which was not the typical index of the glass. I wanted to measure the refractive light from the back of the sphere to determine the index. In this situation, we can make sure that the laser beam is perpendicular to the sphere. But the result was even worse, since the absorption of light must be taken into consideration in this case. We found that, if we put a screen on the back of the sphere, the light will be reflected back, and a pattern like the rainbow will appear on the wall. We might use this phenomenon to determine the refractive index.
Friday, 21 September 2012
We used a crystal ball to produce a rainbow today to see if it's possible to use a glass ball to produce a rainbow. The rainbow we produced was not as faint as I had thought. John said he had observed the yellow light in the rainbow, but I only saw red and green part in the rainbow. The maximum deviation angle of the emergent light is about 20 degrees, but not 42 degrees, because the refractive index of glass is larger than that of water. We decided to make a special screen to measure the rainbow carefully. The screen was made of a cardboard with a hole in the center of it. The hole is used to let the sunlight shine through it to the glass ball. The emergent light will be on the same side of the sun, which means it will form a rainbow on the screen. We also wanted to draw a series of circles with different radii on the screen to measure the radii of different colors in the rainbow. We cannot find a pair of large compasses to draw the circle. Therefore, we used a long polyfoam stick instead. We measured the rainbow again with the screen. We found that it was necessary to make a frame to support the screen.
Wednesday, 12 September 2012
We mainly talked about the simulation I did after our last meeting. I made several graphs of the deviation angle of the light and the incidence position of the light and found that the concentration of light can hardly be seen on those graphs. I tried to use the derivative of the angle and position to describe the distribution of the refracted light and it is clear to see the concentration in that graph. I have some problem of simulating the rainbow with Mathematica and John told me to talk with Arianna on next Tuesday. He introduced Latex to me and showed me several commands of editing my own page. He told me the story of Donald E. Knuth who invented Tex for writing The Art of Computer Programming. Anyway, it sounds inspiring. He also showed the project that he did with Eric Tompkins about the colorful pattern on thin film. He told me that Michael Berry has done many researches on the rainbow which I think is quite hard for me to understand. He introduced a book of John Nye to me, which is Natural Focusing and Fine Structure of Light.
Monday, 27 August 2012
Although I still don't know the mechanism of some of the stuff I saw on my first meeting, I was quite interested in everything I saw. I never knew that I live in such a recondite world before. We started with diffraction gratings and ended with rainbows. Dr. Noé showed us some projects of his former students, and I was astonished by them. Wow, most of them are really good projects. It's interesting to think about how things we see every day work. He showed us a CD and told us how CD players work. It's interesting to know that the light reflected from a CD is different between light from different sources. It needs to focus a laser beam and keep the distance between the lens and the disk constant through some kind of feedback mechanism. He and his student simulated this process in a past project. Another project about deciding whether a beam of laser from the ground can make the pilot blind really impressed me. It reminds me of MythBusters. Dr. Noé also mentioned rainbows during the talk. I was quite interested in that. He told me that he has a glass ball in the lab which may simulate the process of rainbow. And another possible project is about the advertisement cards we played with in our childhood. He showed us some other items in the lab, like that pair of glasses that have diffraction grating on them. The pigs looked so real, although they are just the image of pigs with glass around them.
Home