Data
I used a CCD camera for the images, and Scion Images reformatted the data. (Laser light was polarized for these experiments for better images.)
Low-Pass Filtering With Ronchi Grating
CCD: Exposure time=0ms
Gain=0
Bias=0
This is showing an image of a Ronchi grating filtered with an iris in the Fourier plane. Lengths given are the diameter sizes of the opening of the iris (the filter). Notice how the image is degraded as more and more of the higher spatial frequencies are filtered out. Low-pass filtering is a good demonstration of why aperture size in a lens contributes so much to the final image quality of an image.
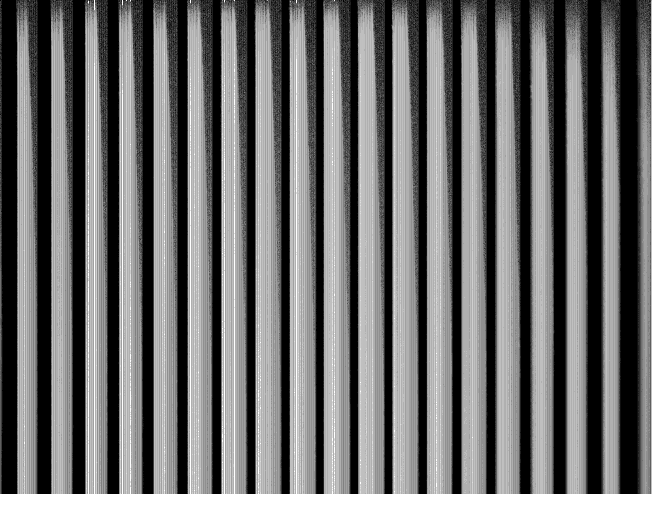
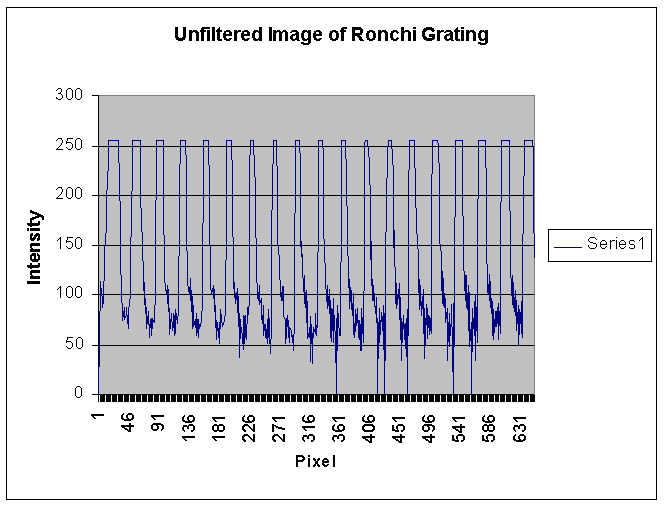
Unfiltered Image and Graph of Ronchi Grating
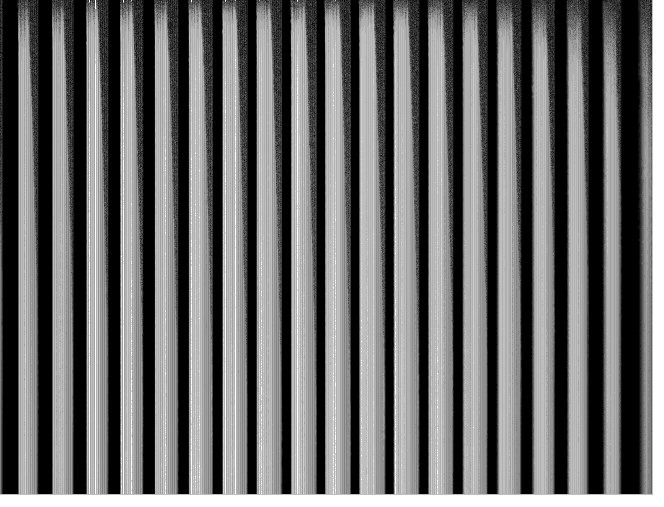
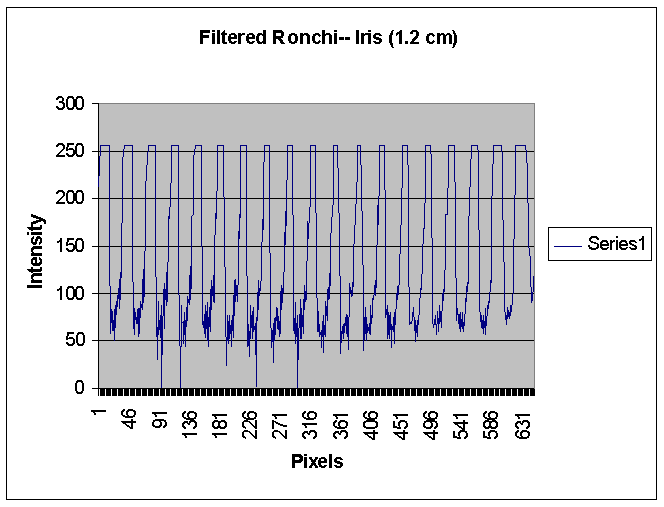
Filtered Image and Graph of Ronchi Grating (Iris- 1.2cm; this is its maximum diameter which still filters out some higher frequencies )
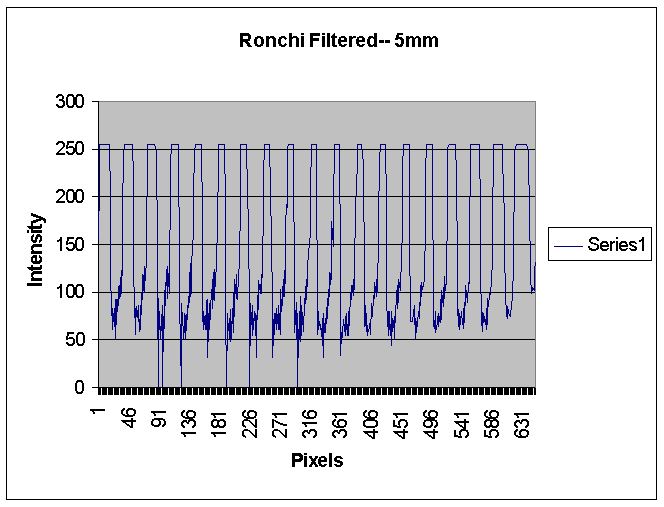
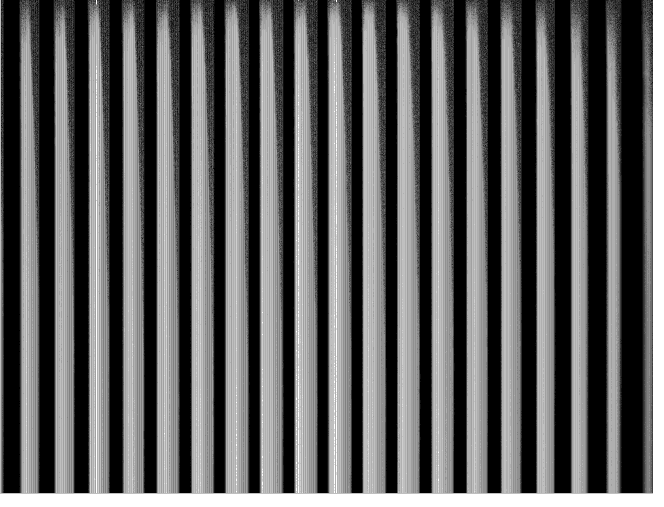
Filtered Image and Graph of Ronchi Grating 5mm
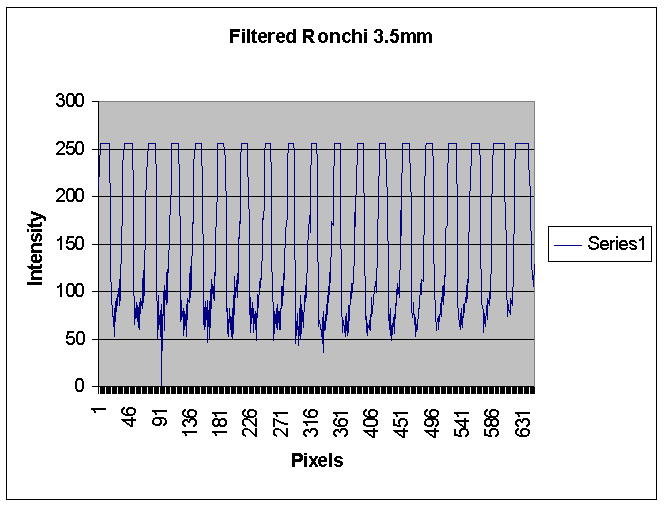
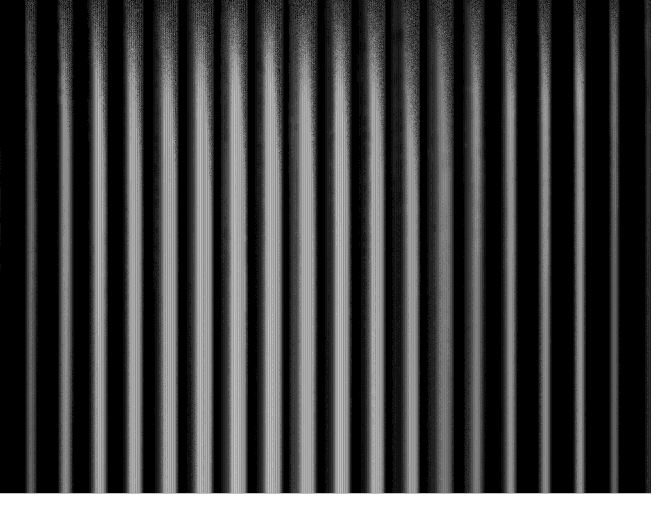
Filtered Image and Graph of Ronchi Grating 3.5mm
Filtered Image and Graph of Ronchi Grating 1mm
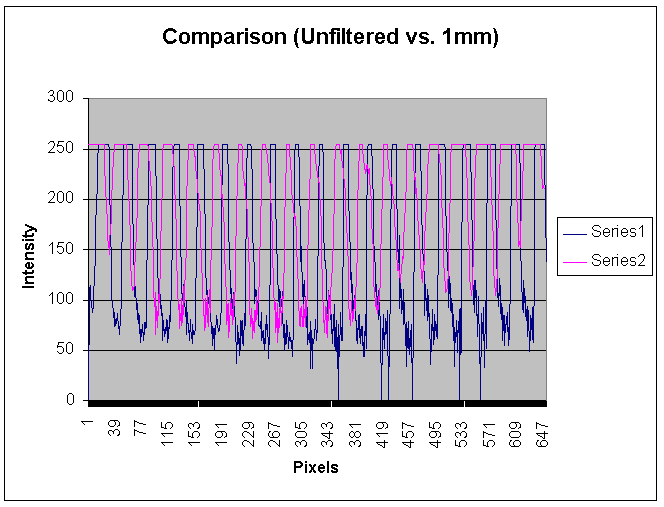
Comparison of the unfiltered image profile (blue) with an image degraded by low-pass spatial filtering (red-- 1mm). Notice how the minima are much less pronounced. This basically shows blurring of the image due to filtering.
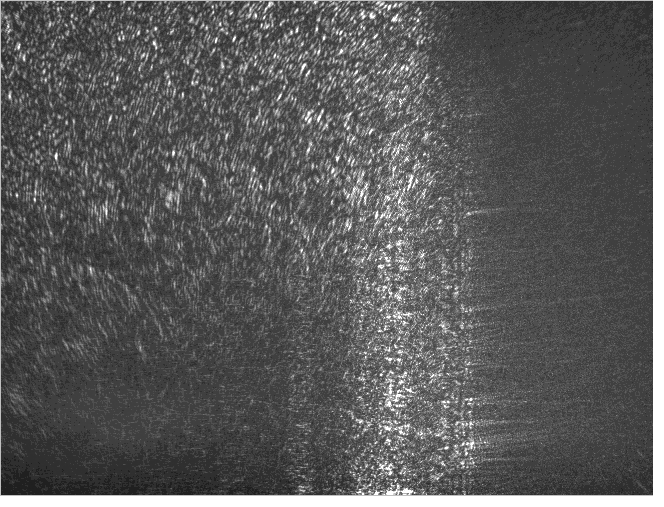
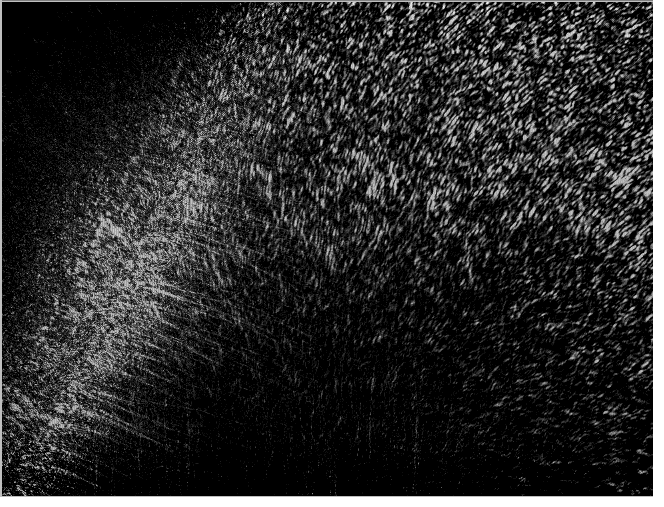
High-Pass Filtering of an Edge (Half-plane)
CCD: Exposure time=16ms
Gain=90
Bias=20
A transparency and liquid paper were used to create high-pass filters. Lengths given are the diameters of the circular obstructions drawn on the transparency material to suppress lower frequencies. Notice that as more and more lower frequencies are suppressed, there develops a clear minimum in the image of where the edge of the original object is located. This minimum is highlighted by two maxima. This is physically sound because higher spatial frequencies are ones that diffract at steep angles around sharp edges. Thus, allowing only higher frequencies to pass promotes edge enhancement. (High-pass spatial filtering enhances the edges of half-planes, where there is a clear barrier between zero and full transmittance.)
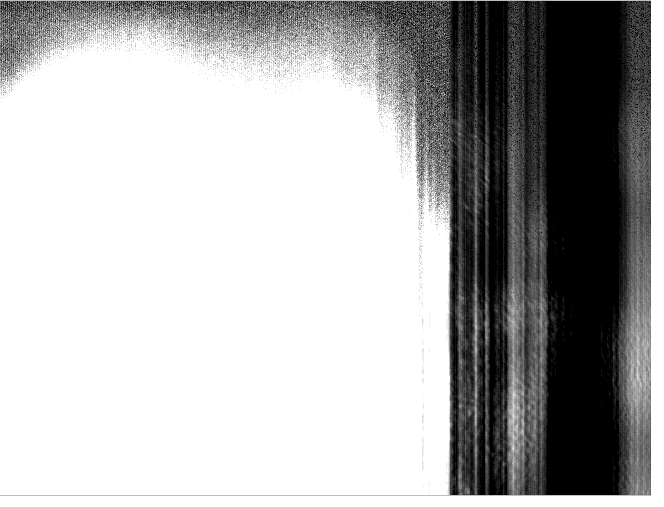
The image of the edge was enhanced with the CCD camera for clarification of its location. (CCD: Exposure time=0ms, Gain=150, Bias=0)

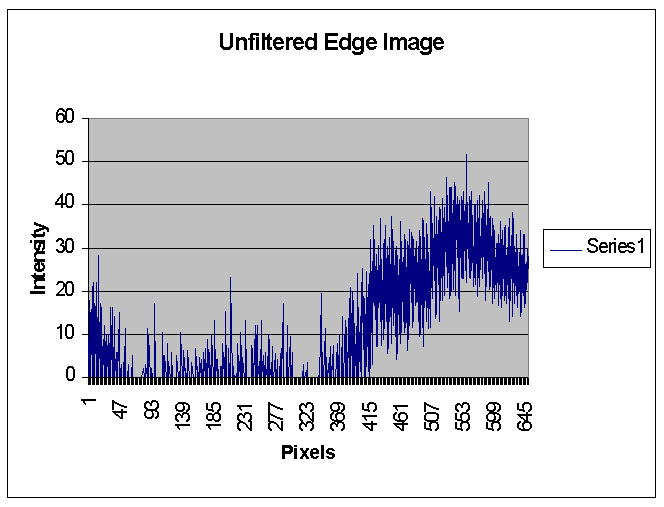
Unfiltered Image and Graph of the Edge (under conditions consistent with the rest of the filtering) Note: this graph has been rescaled so the finer detail can be seen. Scion Image reversed the Intensity graph because of its overall bright profile: all the darker pixels now have higher intensity values. The location of the edge is unclear in this unfiltered image.
Filtered Image and Graph of the Edge 2mm
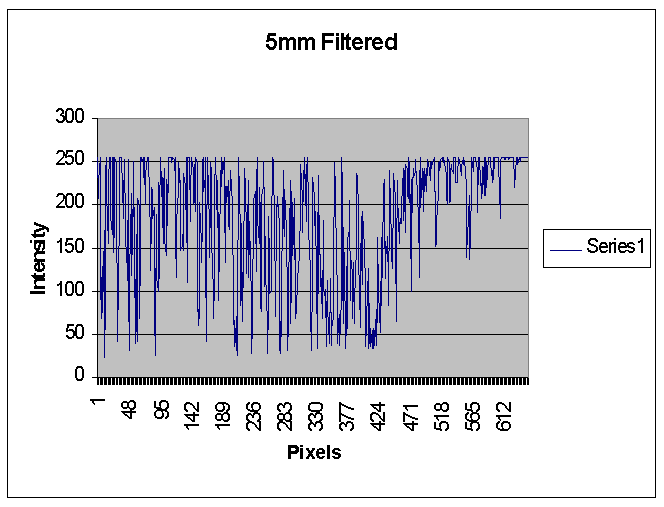
Filtered Image and Graph of the Edge 5mm
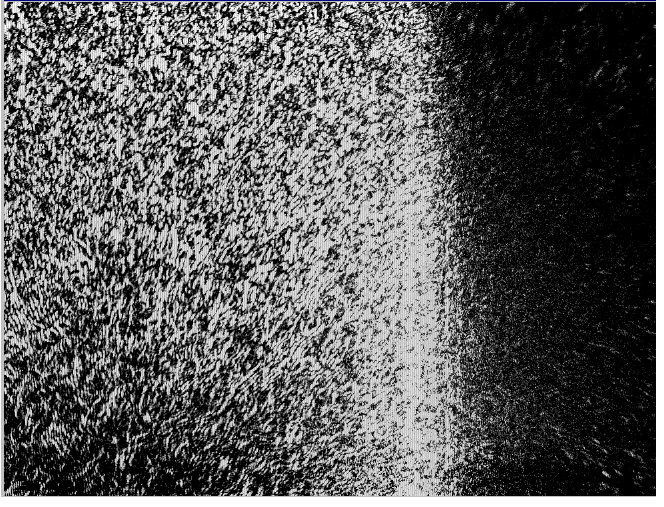
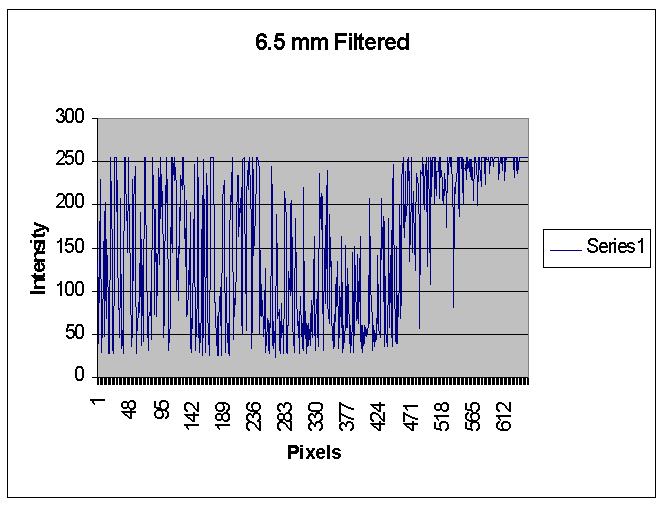
Filtered Image and Graph of the Edge 6.5mm
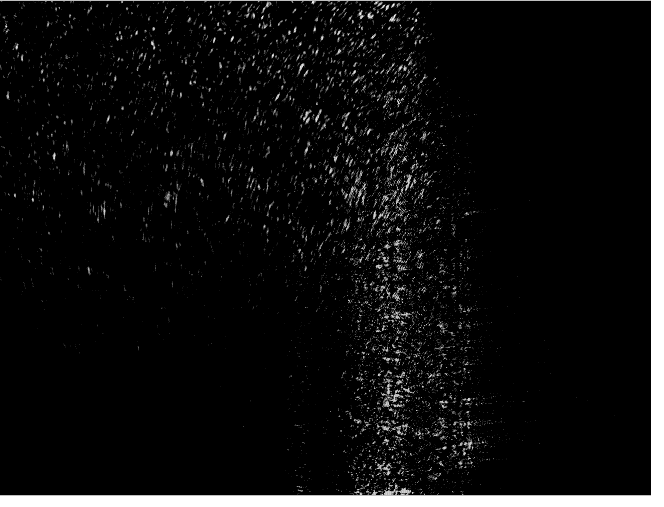
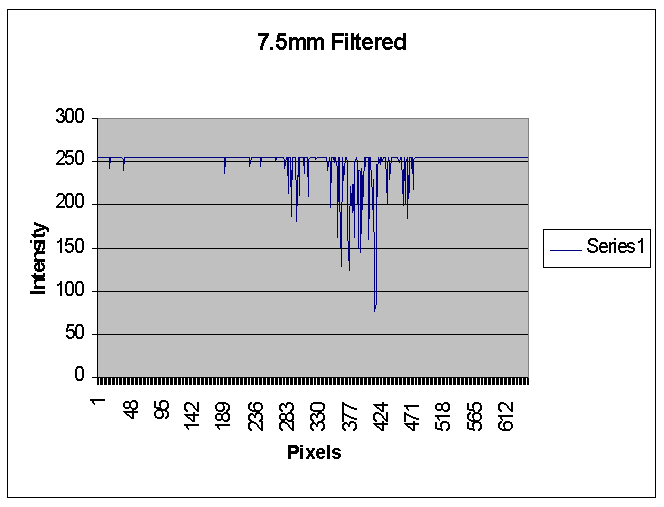
Filtered Image and Graph of the Edge 7.5mm (Note the clearly-defined minimum)
(CCD: Exposure time=12ms, Gain=30, Bias=130)
Filtered Image and Graph of the Edge 7.5mm- Modified
Filtered Image of Triangle Edge
This is just a good picture of edge enhancement. There is a subtle minimum between maxima where the edge of the object is located (on the left).
| Lidiya Mishchenko June 2004 |
My
Webpage Laser Teaching Center |