An Investigation of
`Spectrum' Polarizing Plates
Himadri (Soni) Kakran
Mentor: Dr. John Noé
Laser Teaching Center
Department of Physics & Astronomy
Stony Brook University
Introduction
I decided to do a full-semester project in the Laser Teaching Center after I saw and learned about all sorts of fascinating optical demonstrations and devices at the beginning of the semester. I wanted my project to have something to do with my field of study, Computer Engineering. Every computer engineer should understand the functioning of liquid-crystal display (LCD) screens, so I thought something related to this would make a good project. Polarized light plays an essential role in the working of LCD screens, so I decided to learn more about polarized light. (I knew about linearly polarized light from high school physics, but I had never heard of elliptically polarized light.)
A few weeks into the semester, we noticed that a new item was available from Surplus Shed: `Spectrum Plates' (item number L3692) that had been removed from some obsolete display device. They were said to "work exactly like polarizing sheets but instead of just getting darker the plates change to different colors." We decided to purchase these unknown plates and try to figure out how they worked.
Background
Polarized light describes the orientation of the electric field vector in light waves. The general form of polarized light is elliptical where the tip of the electric field vector describes an ellipse in the plane of projection. This happens when the two components of electric field vector are out of phase and are of different amplitudes. Furthermore, there are two special cases of elliptically polarized light; linearly polarized and circularly polarized. When the two components of electric field vector are in phase the resultant light is linearly polarized whereas when the two components are ninety degrees out of phase the resultant light is circularly polarized.
In order to form elliptically polarized light it is required that random light (unpolarized light) be first passed through a linear polarizer and then through a retarder. A retarder is a birefringent material having a different refractive index along each of two perpendicular axes. Due to this difference in refractive index the retarder (waveplate) creates a phase difference between the components of the electric field vector along each axis. The retardance of a wave plate can be expressed as:
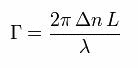
here Δn is the difference in the two refractive indices, L is the thickness of the waveplate and λ is the wavelength of the incident light. As observed in the formula, the retardance(Γ) of a waveplate is inversely proportional to wavelength(λ), provided Δn doesn't change with wavelength.
Observations of the spectrum plates
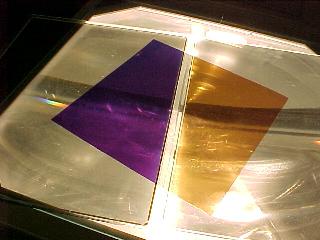
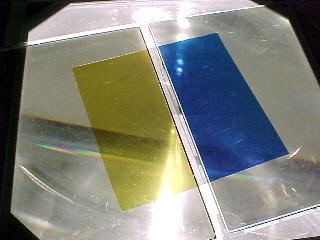
Spectrum plates viewed through a linear polarizer sheet. The sheet
is rotated about 90 degrees
between the two images. Note also that the two
plates produce complimentary colors.
The first thing we noticed was that the plates produced a different effect depending on which side was facing the unpolarized light source. We labelled the two sides A and B and did the following tests to try to figure out why it mattered which side faced the light source.
First we placed side A down, facing the randomly polarized light source, and observed the transmitted light through a linear polarizer sheet (an analyzer). As we rotated the analyzer we observed beautiful colors that changed as the analyzer sheet was rotated. The resulting light was hypothesized to be elliptically polarized. As discussed earlier, in order to obtain elliptically polarized light, it is necessary to pass unpolarized light first though a linear polarizer and then a retarder. Therefore, side A was assumed to be a linear polarizer and side B was assumed to be a retarder.
Next, we turned the plate over, so that side B was down, facing the light source. As we rotated the analyzer sheet we observed either complete transmittion or zero transmission. We know that a retarder has no effect on unpolarized light, so we concluded that the resulting light was linearly polarized and therefore side A was a linear polarizer and side B was a retarder, verifying our earlier assumption.
Thus the spectrum plates are a sandwich of a linear polarizer [A] and a retarder [B].
So why then do colors appear? White light is a mixture of all visible wavelengths, so the colors are all there from the beginning. But different wavelengths have a different retardance, according to the formula above, and therefore the ellipticity of the transmitted light depends on wavelength. When analyzed with the final linear polarizer the elliptically polarized light is passed to different degrees. In other words some colors are suppressed or even totally blocked while others are fully transmitted.
Determining retardance (theory)
The next step was to determine the relationship between the retardance of the plate and wavelength of incident light. One can see from the formula that the retardance of a waveplate is inversely proportional to the wavelength of the incident light. Thus if a plot of retardance vs. 1/wavelength was to be made, the graph should be a straight line passing through the origin. Of course, this will be true only if Δn is relatively independent of wavelength.
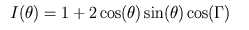
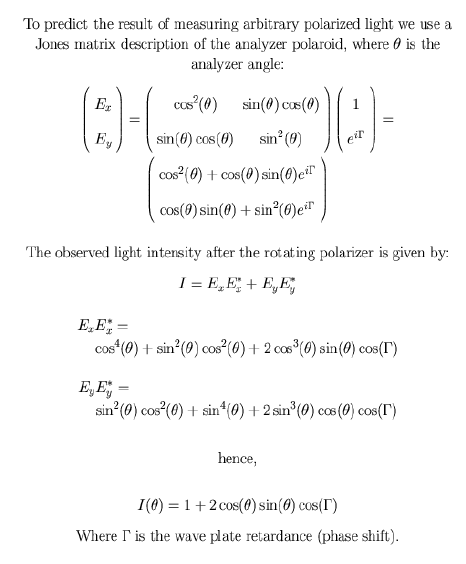
To construct a plot of retardance vs. 1/wavelength it was necessary to measure the intensity of the resultant elliptically polarized light for different wavelengths. This would help in determining the retardance of the waveplate for each wavelength. Using the Jones matrix analysis a formula was derived for the intensity of the resulting light in terms of the retardance of the plate. The final formula expressed the intensity of any arbitrarily polarized light passed through a linear polarizer. The intensity of the resulting light was found to be:
Here's the Jones matrix calculation I did to get this result.
Determining retardance (experiment)
As stated earlier the main goal was to determine the retardance of the waveplate for certain wavelengths provided in the Laser Lab. Four different lasers were used for the experiment.
| Wavelength | Color | Name |
| 633 nm | Red | Helium-Neon |
| 488 nm | Blue | Argon |
| 543.5 nm | Green | HeliumNeon |
| 594.1 nm | Yellow-Orange | Helium-neon |
In the setup, firstly the given laser was mounted on a stand. In front of which the 'spectrum' plate was placed in an upright position with its linear polarizer side facing the laser and the retardar side facing the opposite direction. Next we placed a rotating analyzer followed by the photo-detector.
The photodetector was connected to a multimeter and the intensity of the resulting light from the spectrum plates was recorded in milli-amperes.
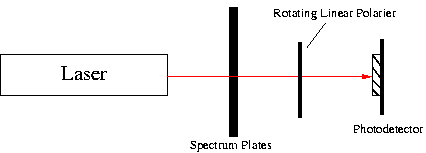

The above rotating dial consisted of a mounted linear polarizer.
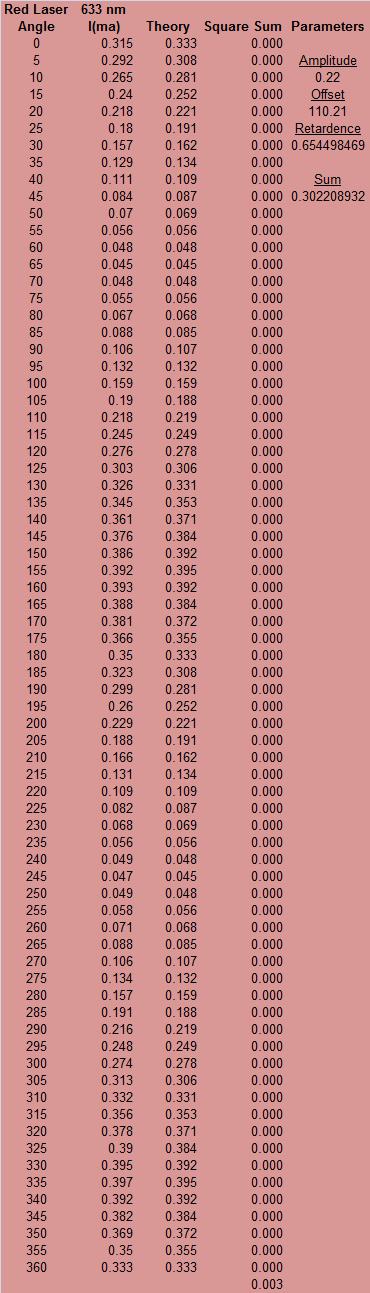
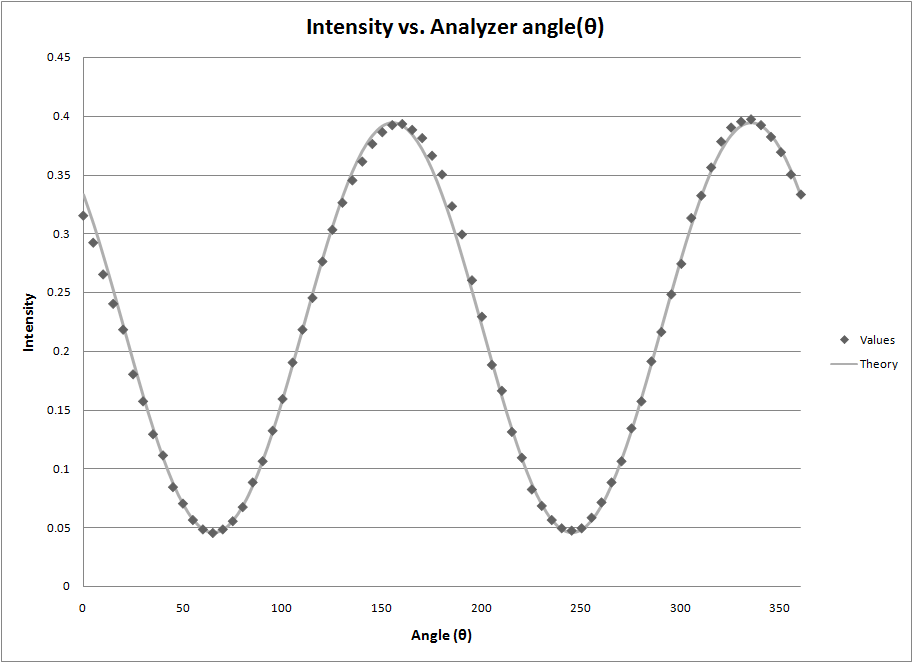
We measured the intensity of light as a function of the rotating analyzer angle in increments of five degrees. An intensity verses angle plot was then created using the measured values. A theory curve was also plotted on the same graph using the earlier derived formula for the intensity of an arbitrary polarized light. Using Excel and the square-sum formula, the different parameters(amplitude, offset, retardance) were manipulated so as to best fit the theory curve to the observed values. Thus, the value of retardance for the given wavelength was determined. The above procedure was repeated for each individual laser. It is to be noted that the retardance determined for each wavelength was always between 0 and 180 degrees, as explained further below.
A sample set of data table and graph for the red laser.
Data Analysis and Result
As these experiments only determined the effective retardance(say x) of the plates between 0 and 180 degrees, the next step was to determine the total retardance of the 'spectrum' plates. Given the fact that this effective retardance corresponds to many possible values of the total retardance according to the relationship =m*(360)+-x where (m=1,2......), other values greater than 180 degrees were calculated. We plotted these possible values of total retardance as a function of 1/wavelength. Thus, by fitting a line from the origin through the ambiguous measured retardance values, we determined the total retardance of the 'spectrum' plates with respect to any wavelength.
Retardance vs. 1/wavelength graph of Plate 2
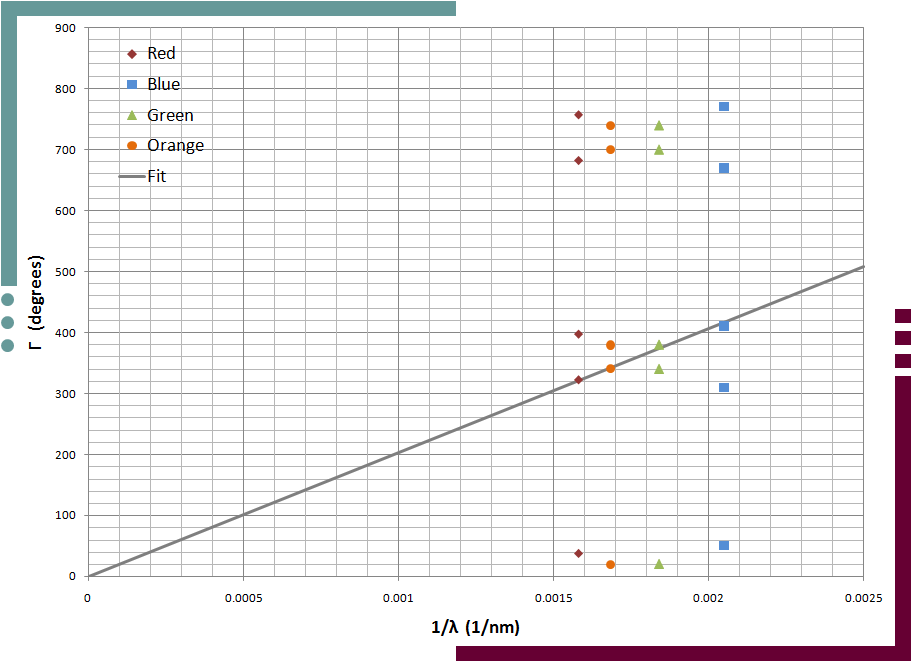
The calculated slope of the line was 3.547 * 10^(-6)
References
A good reference for Jones matrix calculus is:
Eugene Hecht, Optics, Third Edition, (Addison-Wesley)
Himadri Kakran
© COPYRIGHT 2009 ALL RIGHTS RESERVED HIMADRI KAKRAN