|
An Electro-optical Sensor to Measure Pulse Rate
Phuong Nguyen and John Noé
Laser Teaching Center
Dept. of Physics and Astronomy
Stony Brook University
Introduction
This semester I'm taking the junior-level electronics course (PHY335) and this soon made me realize that I am
very interested in electronics. Therefore it was natural to look for a project that involves both optics and
electronics. Such a project would also help prepare me for the work I'll do this summer in Prof. Eden Figueroa's
lab. The project we found uses reflected near infrared (IR) light to observe pulse strength and rate. We
started out using a commercial bandpass amplifier but I later built my own amplifier with two op-amp stages, that
flashes an LED on each pulse. This experience was a nice complement to the theory of filter circuits that was
covered in my course.
The method I used is called photoplethysmography or PPG for short. It's based on the fact that light
reflected from skin, or transmitted through a finger tip or earlobe, changes very slightly with each heart beat,
as fresh blood is pushed into the tissue. For an adult over 18 years old a normal pulse rate is 60-80 beats/min or
1.0 - 1.33 Hz.
PPG method has been used in many biomedical applications and has many advantages as it uses simple and
inexpensive sensors which can easily be placed in a small portable device. There are two types of sensor:
transmitting and reflecting sensor. Transmission in PPG is commonly used when measuring the oxygen concentration
in blood rather than heart rate measurement. Such pulse oximeter devices are more complicated than simple PPG and
use two or more wavelength of light.
PPG Sensor
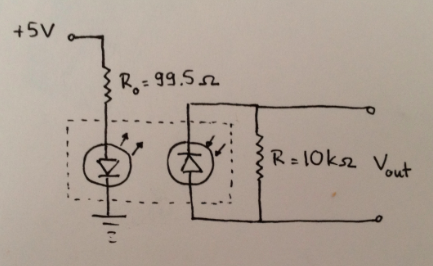
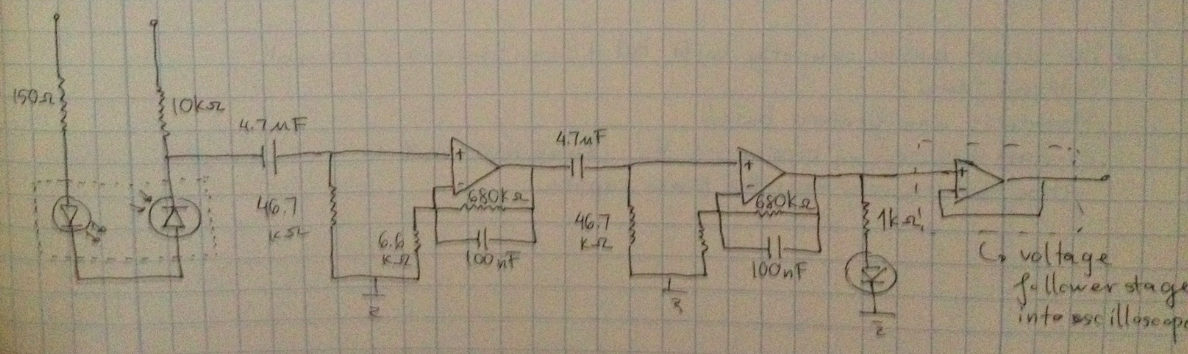
The sensor for our device is made from a IR LED and a photodiode mounted side by side. The matched pair of
devices was purchased from Radio Shack (model 276-0142) for just about $3. The emission peak is at 850 nm; the
detector responds to 750-980 nm and and is most sensitive at 900 nm. The 99.5 ohm resistor in series with the
LED limits the current to half its maximum value 100 mA. We put a 10k resistor across the photodiode to convert
its current into a voltage.
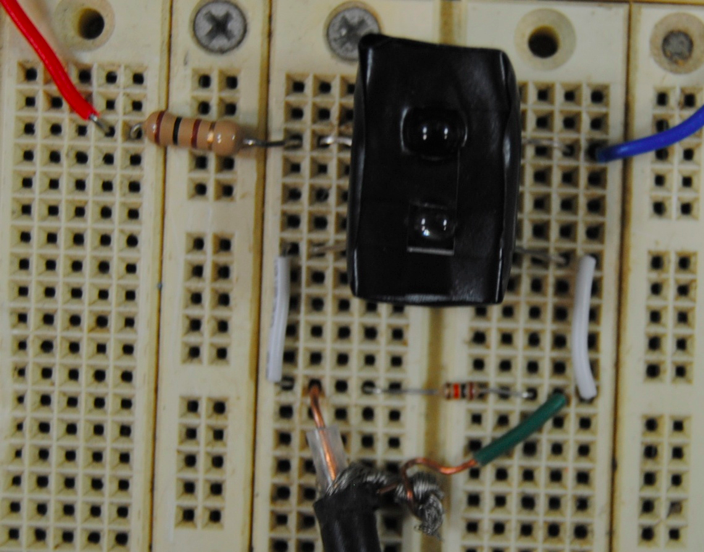
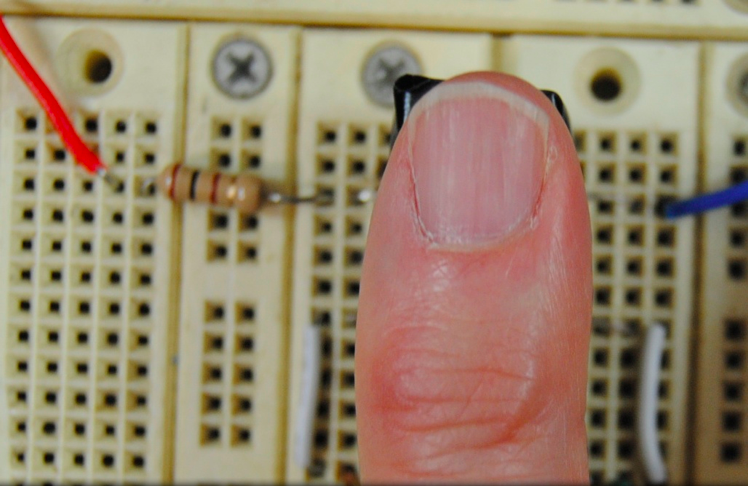
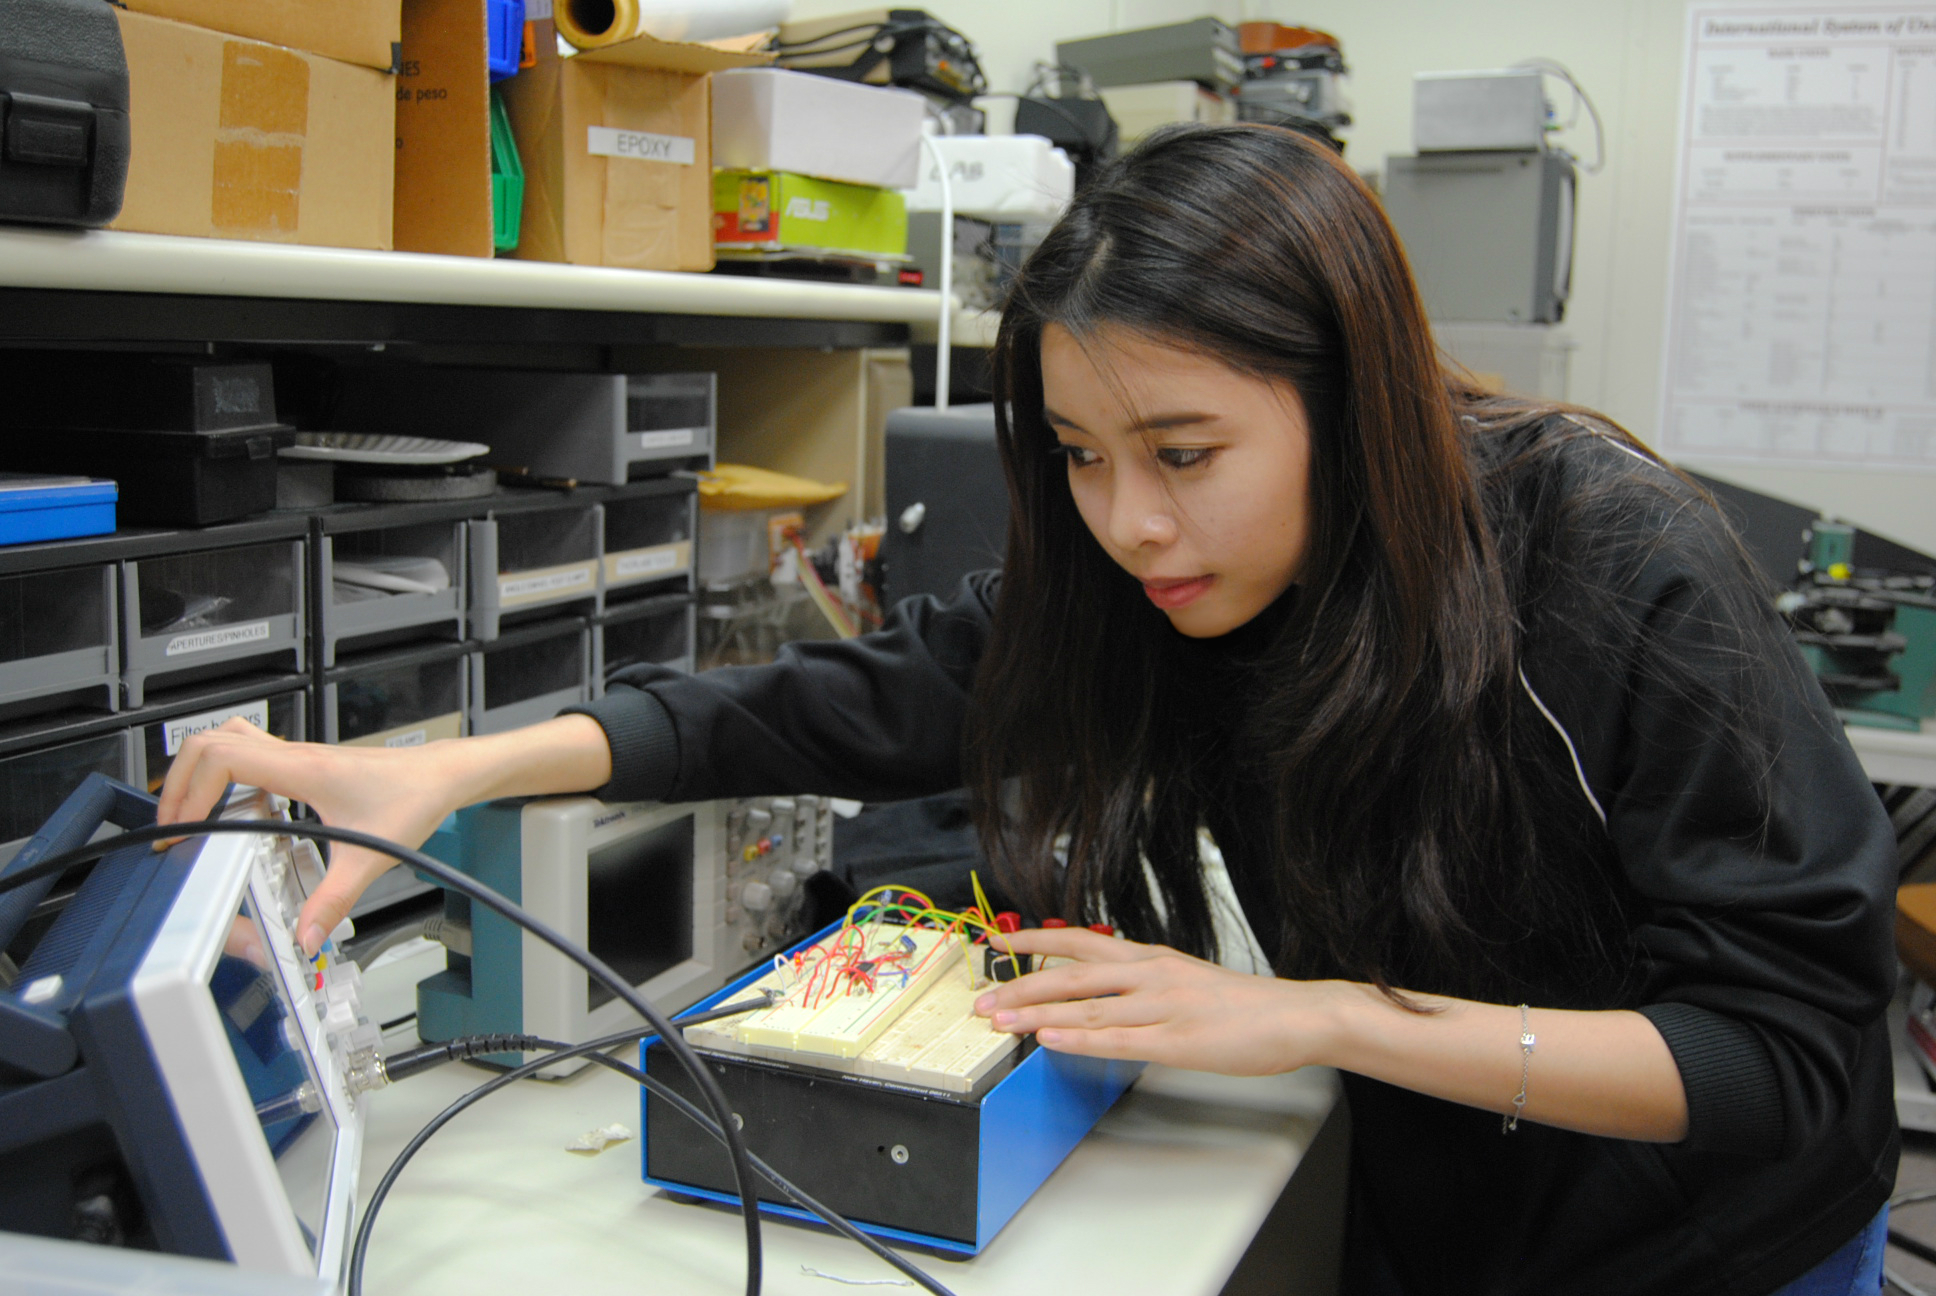
The emitter and detector are set up next to each other, in a small container made from black foam and black
tape, as shown in the picture. To observe pulse we only need to rest our finger gently on the sensor covering both
emitter and detector. Pressing too hard migh block circulation causing noise in signal or no signal at all.
First Experiments
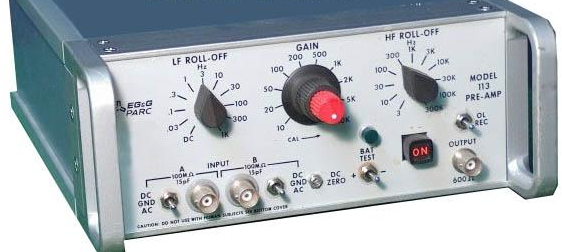
In the first version of our device the voltage from the 10kΩ resistor is taken to a separate commercial
amplier (PAR 113) via a short coaxial cable. We selected AC coupling for the input and a frequency range of
0.3 Hz to 10 Hz. This is wider than the optimum range for pulse rate but was the most suitable setting available.
The output signal from the amplifier was recorded on a digital oscilloscope. We didn't have a way to transfer
the traces so we just took pictures of them.
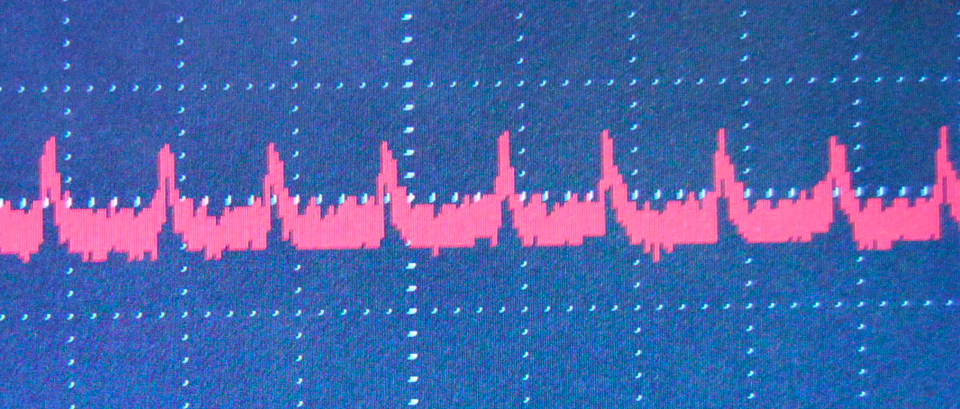
We looked at Dr. Noé's pulse first, and got a strong signal right away. The amplifer gain was 100, the
oscilloscope was set at 1.0 Volt and 1.0 second per division. According to the calculator in the scope the pulse
rate was 78 bpm. The signal displayed was in sync with pulses felt on the wrist.
We next tested Yuning, a graduate student. We had to use a higher gain (500) and more 'scope sensitivity (500
mV/div) to get a good signal but it wasn't difficult to find one. The measured rate was 61 bpm.
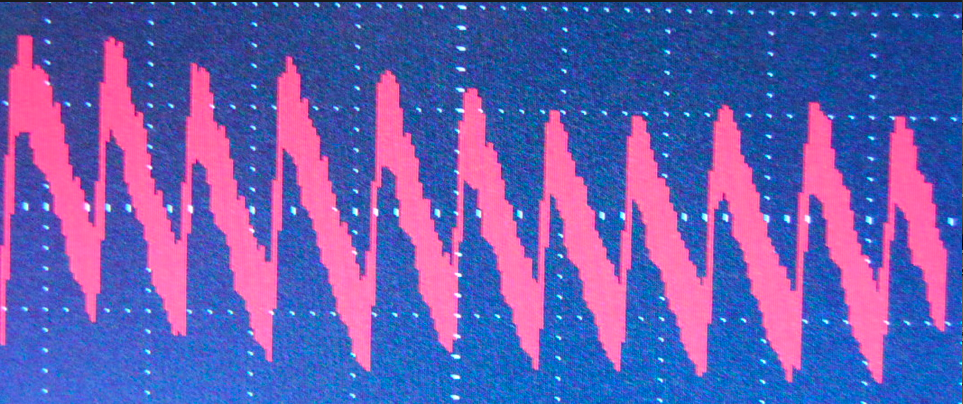
Finally we tested me, the student. Even with the sensitivity turned up even more, to 200 mV/div, it was VERY
difficult to get a stable signal, and when we did get a signal it didn't look like a "pulse," but more like a
sawtooth. Getting a signal was very dependent on having just the right position and pressure, and keeping the
finger (I used my fore-finger) very still. The difficulty could also be due to the fact that I have poor blood
circulation in general.
Building an optimized band-pass amplifier
The circuit I build was described on a web site I found [1]. It includes 2 stages of active band-pass filter,
and a non-inverting buffering stage. I calculated the gain to be 104 per stage or
10,816 in all. The gain is so high that the output clips at the +5 Volt rail on each pulse. The narrow band-width
of 0.7 - 2.4 Hz is centered around the expected rate for an adult's pulse.
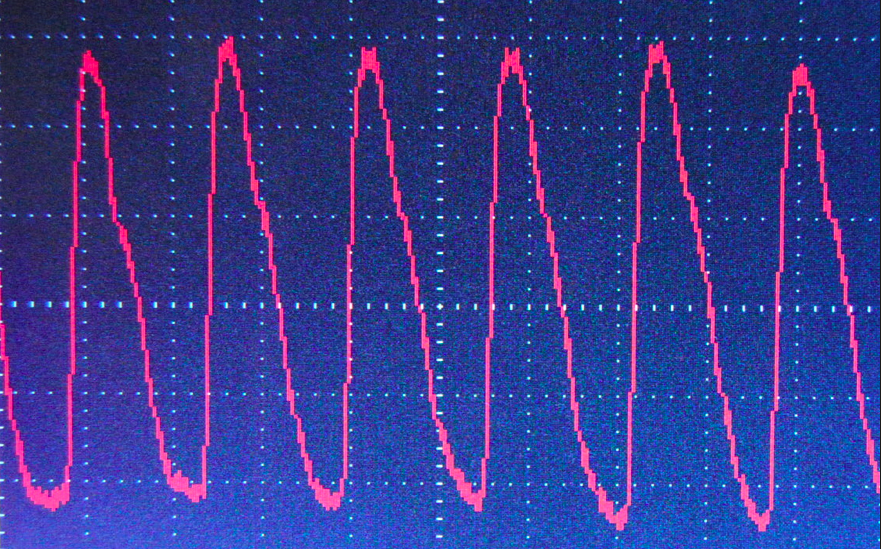
The amplified signal drives an LED light and can be observed on an oscilloscope. Some results for the
signal obtained are shown below:
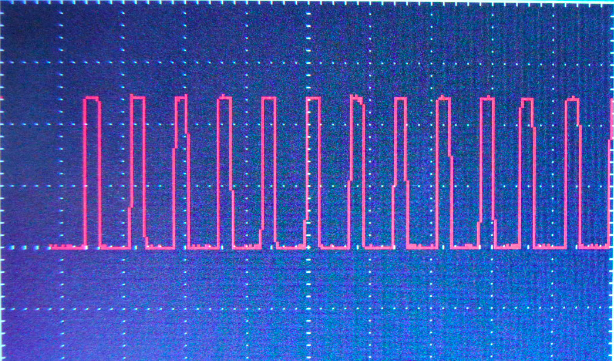
Dr.Noe's pulse, 1.4Hz (84bpm), 2V/div
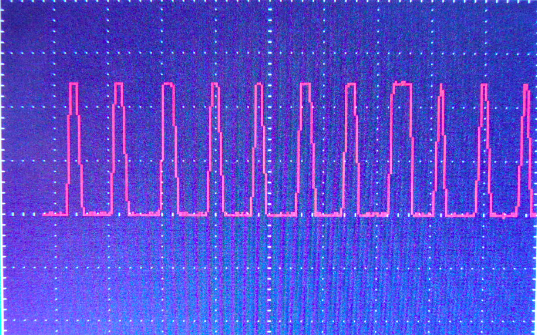
My pulse, 1.2Hz (72bpm), 2V/div
Unanswered questions and future work
The circuit itself is proved to work well. However, we need more work
on the sensor part since it couldn't detect signals from a few individuals.
Even in my case, I had to be very still to get the signal detected on the
scope. It would be nice to talk to the person who designed this circuit to
see if his experience with it is similar to ours.
Acknowledgement
I want to thank Dr. Noe for suggesting this project to me as well as
wholeheartedly guiding me throughout this semester. His encouragement and
time dedication helped me so much in completing this project in a short
period of time.
I would also like to thank Professor Tom Allison for the use of
oscilloscpe to capture the images of the detected pulses. Finally, I would like to
thank Marty for giving me some insights of what might have been the
problem with the origional sensor; and many other friends who were willing
to try out this device.
References
[1]Introducing Easy
Pulse: A DIY photoplethysmographic sensor for measuring heart rate
|