|
Modulation Study
Doug Broege; Advisor: Peter Koch
goal of study:
The purpose of this research is to study both theoretical and practical aspects of modulation of electromagnetic signals
at radio, microwave, and optical frequencies. Progress is to be reported on this site as accomplished. This study is
being carried out under the supervision of Professor Peter Koch of the physics department at SUNY Stony Brook.
14 Feb, 2003
On Monday I was introduced to the Wavetek 148A function generator, the HP 8566A spectrum analyzer, and a digital oscilloscope in Professor Koch's lab. I have spent this week reading the manuals and familiarizing myself with the instruments.
26 Feb, 2003
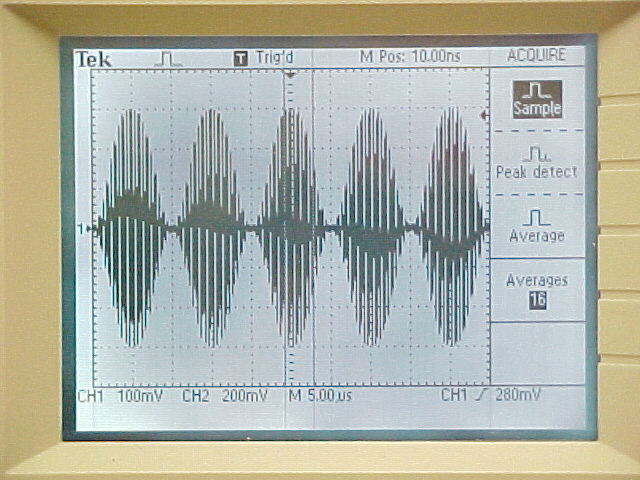
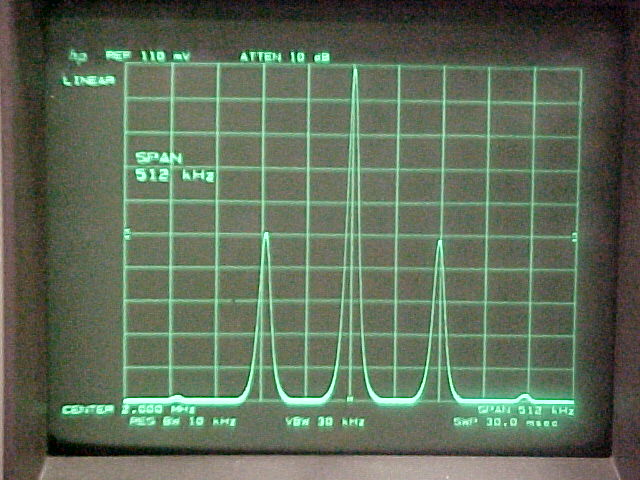
This week I learned a little more about the spectrum analyzer and had my first look at sidebands produced by modulation. I was shown that by altering the amplitude and frequency of the modulation, one can lower the amplitude of certain sidebands. My assignment for the week is to look into bessel functions to gain a better understanding of the power spectrum of a modulated signal and to quantitatively observe these effects with the spectrum analyzer.
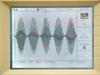
Amplitude modulated waveform on scope and spectrum analyzer
(click thumbnails for larger image)
3 March, 2003
It turns out that the amplitude of each frequency component in a
frequency modulated or phase modulated signal is a Bessel function.
Each sideband differs from the carrier frequency by a multiple of the
modulating frequency and it is this multiple that dictates the index
of the corresponding Bessel function (for example, a sideband that has
a frequency that is larger or smaller than the carrier frequency by
twice the modulating frequency would have a Bessel amplitude with an
index of 2). The amplitudes of these Bessel functions depend on their
argument, which contains both amplitude (frequency deviation) and
frequency of modulation. By altering either of these two, one can see
the sidebands change amplitudes on the spectrum analyzer. I have
looked up a number of zeros for the first five bessel functions and
have used them to measure the amplitude of modulation when modulating
frequency. The amplitude of modulation is the only argument of the
Bessel amplitudes of the phase modulated sidebands. Because the
signal generator is not capable of delivering a very high phase
change, I was not able to observe the zeros of the sideband amplitudes
while modulating phase.
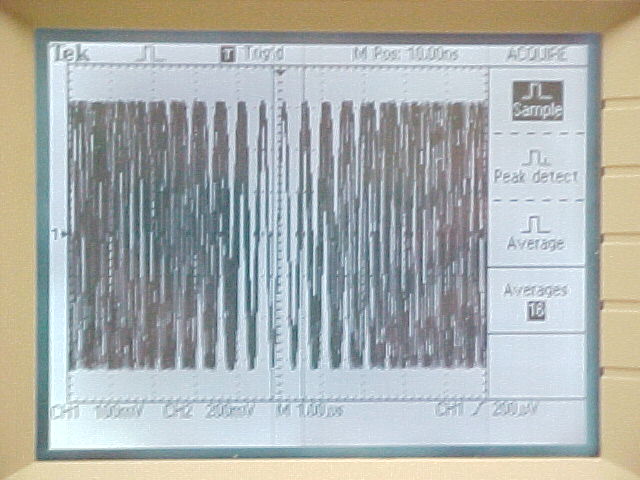
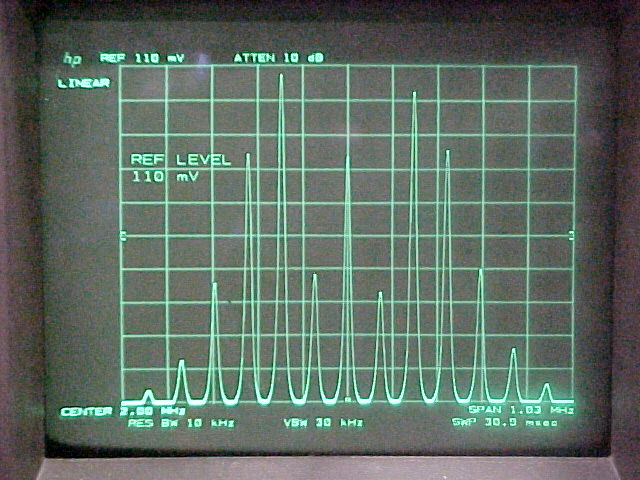
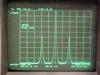
 a frequency modulated waveform on scope and spectrum analyzer
4 March, 2003
The measurements that I've made thus far aren't so good for checking that the sideband amplitudes are indeed Bessel functions because I had to assume that they were Bessel functions to make the measurements. I made these measurements by varying modulation frequency, assuming the amplitudes were bessel functions, and using this fact to measure the frequency deviation, which came out to be the same value for each modulation frequency. A good test of the Bessel amplitudes would involve changing both modulating frequency and frequency deviation and measuring the zeros. What would make this hard is the fact that one can change the frequency deviation, but its a bit harder to quantitatively control how large the deviation is. I also learned about Johnson noise today, it is the voltage one would read across an ambient resistor with an AC voltmeter.
28 March, 2003
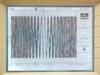
Since my last update I have been introduced to the saturation spectroscopy experiment in the Sr Lab room. The observed signal in this case comes from a photodiode. The light shining into the photodiode comes from a diode laser which passes through a cell containing rubidium vapor. As the laser sweeps frequencies, dips in intensity can be seen on the oscilloscope corresponding to absorption of light by the rubidium atoms. Oscilloscope screen shots can be saved to disk for quantitative analysis. I have estimated the Doppler width of rubidium at room temperature to be ~.37 Ghz. This is large enough to mask the hyperfine structure of the upper p state, but not the lower s state. The Doppler broadened spectrum consists of four peaks corresponding to two lower hyperfine levels in two isotopes. I have taken data consisting of 3000 (x,y) pairs. To convert these arbitrary x values into frequency, I took the frequency separation between two peaks and divided by their separation in boxes. I have measured the Doppler width of these four peaks to be 0.36 Ghz (Rb85 F=2), 0.37 Ghz (Rb87 F=1), 0.36 Ghz (Rb87 F=2) & 0.36 Ghz (Rb85 F=3).
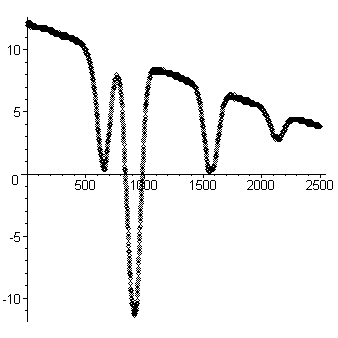 Doppler broadened spectrum of Rb (arb units). Transitions are Rb87 (F=2), Rb85 (F=3), Rb85 (F=2), Rb87 (F=1).
Plot is sloped because the laser's intensity is proportional to the injection current.
10 April, 2003
The purpose of the satspec setup is to eliminate the Doppler broadening. This works as follows. Three beams pass through the cell, two weak beams in one direction (probe beam and reference beam) and one stronger beam in the opposite direction (pump beam) which overlaps with the probe beam. Both the reference, and probe beams shine into photodiodes, the signals of which are send into an op amp box designed to subtract the two. In the absence of the pump beam, the signal is always zero because the vapor absorbs equal amounts of each (this is assuming that their intensities are low enough so that the photodiodes behave linearly). When the pump beam is added, the system behaves in the same manner, except at frequencies where the pump and probe beam fight for the same atoms. In this case, the pump beam always wins because it is the more intense of the two. As the laser sweeps frequencies, the two beams target different atoms for a particular transition because they are propagating in different directions and moving atoms view their frequencies to be different via the Doppler shift. The only time this doesn't happen is when the atoms are moving at zero velocity along the beam axis, in this case, when the laser sweeps over their resonant frequency, the two beams fight for them. This effect is desirable because the difference between probe and reference beam intensities is no longer zero and this results in very sharp peaks corresponding to the Doppler free spectrum of rubidium. An undesirable consequence of the counter-propagating beams is that they will at times compete for the same atom, but different transitions. This can happen when the laser sweeps over the midpoint between two transitions. a moving atom sees one beam Doppler shifted towards one transition, and the other beam Doppler shifted towards the other. This process results in a number of extra peaks in the spectrum known as crossover peaks, which have no physical significance. They can however be used to calibrate the frequency axis during analysis.
10 April, 2003
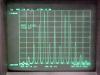
I have successful satspec setup and have begun taking data. Although saturation spectroscopy eliminates Doppler broadening, the peaks are not perfect delta functions. This can be understood through the uncertainty principle. Because the excited states have a finite lifetime, they must have a spread in energy, which corresponds to a spread in frequency. The fourier transform of an exponential is a lorentzian and this is exactly the natural lineshape of these Doppler free transitions. Atomic lifetimes dictate the natural linewidth of a transition, but because these atoms are in a laser light field, they oscillate between excited and ground state at a rate faster than they would normally decay. This results in a larger linewidth (lineshape still lorentzian,). Because the frequency at which the atoms "flop" increases with increased laser intensity, this phenomenon is known as power broadening. The most easily viewed set of transitions are those that originate in the F=2 state of Rb87 because the upper states are spread farther apart. The natural linewidth of these transitions is 6.366 Mhz (FWHM). This comes from a 25 ns lifetime. In practice, the only peak that was far enough removed from the rest to do a Chi squared fit on was that corresponding to the F=2 to F=3 transition. The measured width was 19.37 +-1.34 Mhz. Other peaks could be eyeballed to have widths around 30-35 Mhz, but not much more could be said about them quantitatively.
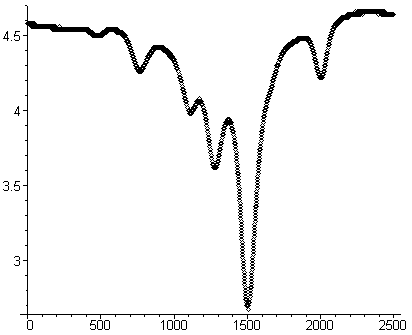 Doppler free spectrum of Rb87 (arb units). Six peaks from left to right are: transition (F=1),
crossover (F=1&2), transition (F=2), crossover (F=1&3), crossover (F=2&3), transition (F=3)
7 May, 2003
The ultimate goal of getting to know the satspec setup was to use it to observe the frequency content of the laser. The plan was to modulate the laser's injection current at a frequency in the Mhz range on top of the slow modulation. This would allow me to view sidebands as the laser swept across transitions. because each satspec bump would now have sidebands, the only area that these sidebands would be observable is to one side of the set of six peaks. Fast modulation was attempted at 20 Mhz, but little was seen because the widths of the peaks themselves are ~20 Mhz. If anything is to be seen, it will have to be at a higher modulation frequency.
|