Optics Rotation Project of Douglas Bennett
Advisor: Prof. Chris Jacobsen
Title: Computer Generated Holograms
In 1948, Denis Gabor proposed a method of recording both amplitude and phase information of light diffracted off an object by recording the intensity of the interference pattern between the light and a coherent reference beam. An image of the original object can be obtained from the recorded interference pattern. He called the recorded interference pattern a hologram, meaning total recording. Gabor's primary motivation for holography was its potential use in electron microscopy. For my rotation project I used the theory of wave propagation to create holograms from images. These holograms were then recorded to 35 mm slides. Finally I attempted to reconstruct the images from the holograms using a laser as the coherent light source.
Gabor Holography[1]
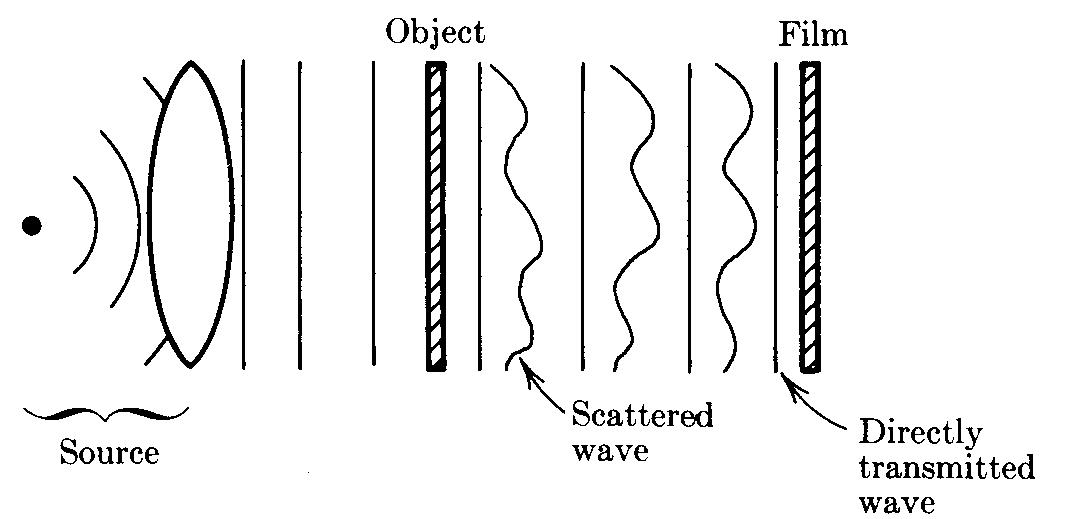
The type of holography originally proposed by Gabor, utilized an inline setup. The source, object and film are all in a line as shown in Figure 1.
Figure 1: Gabor Holography Setup [1]
The coherent light produced by the source is transformed into a uniform plane wave by a lens. The uniform plane wave that is transmitted through the highly transmissive object consists of two components. The first is a uniform plane wave and the second is a weak scattered wave. The film records the intensity of the interference pattern at some distance z from the object.
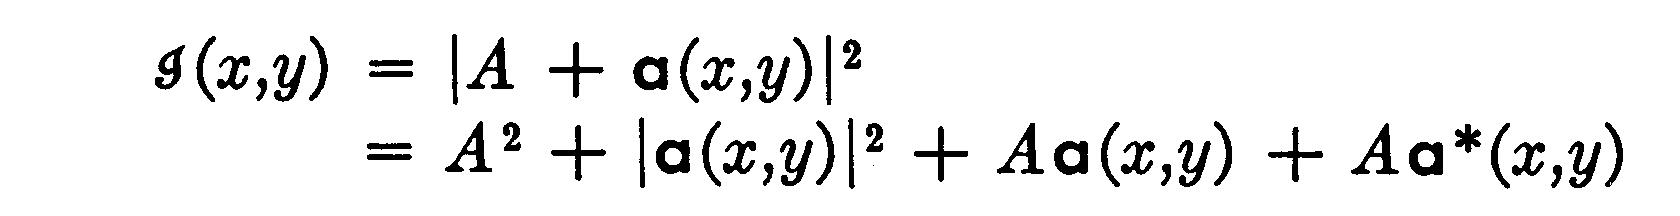
Where a is the amplitude of the wave scattered by the object and A is the reference wavefront. The intensity of this interference pattern depends on both the amplitude and phase of the scattered wave. The film is developed and assumed to have transparency proportional to that of the object.
The hologram is then illuminated with uniform plane waves as shown in the figure below.
Figure 2: Reconstruction Setup [1]
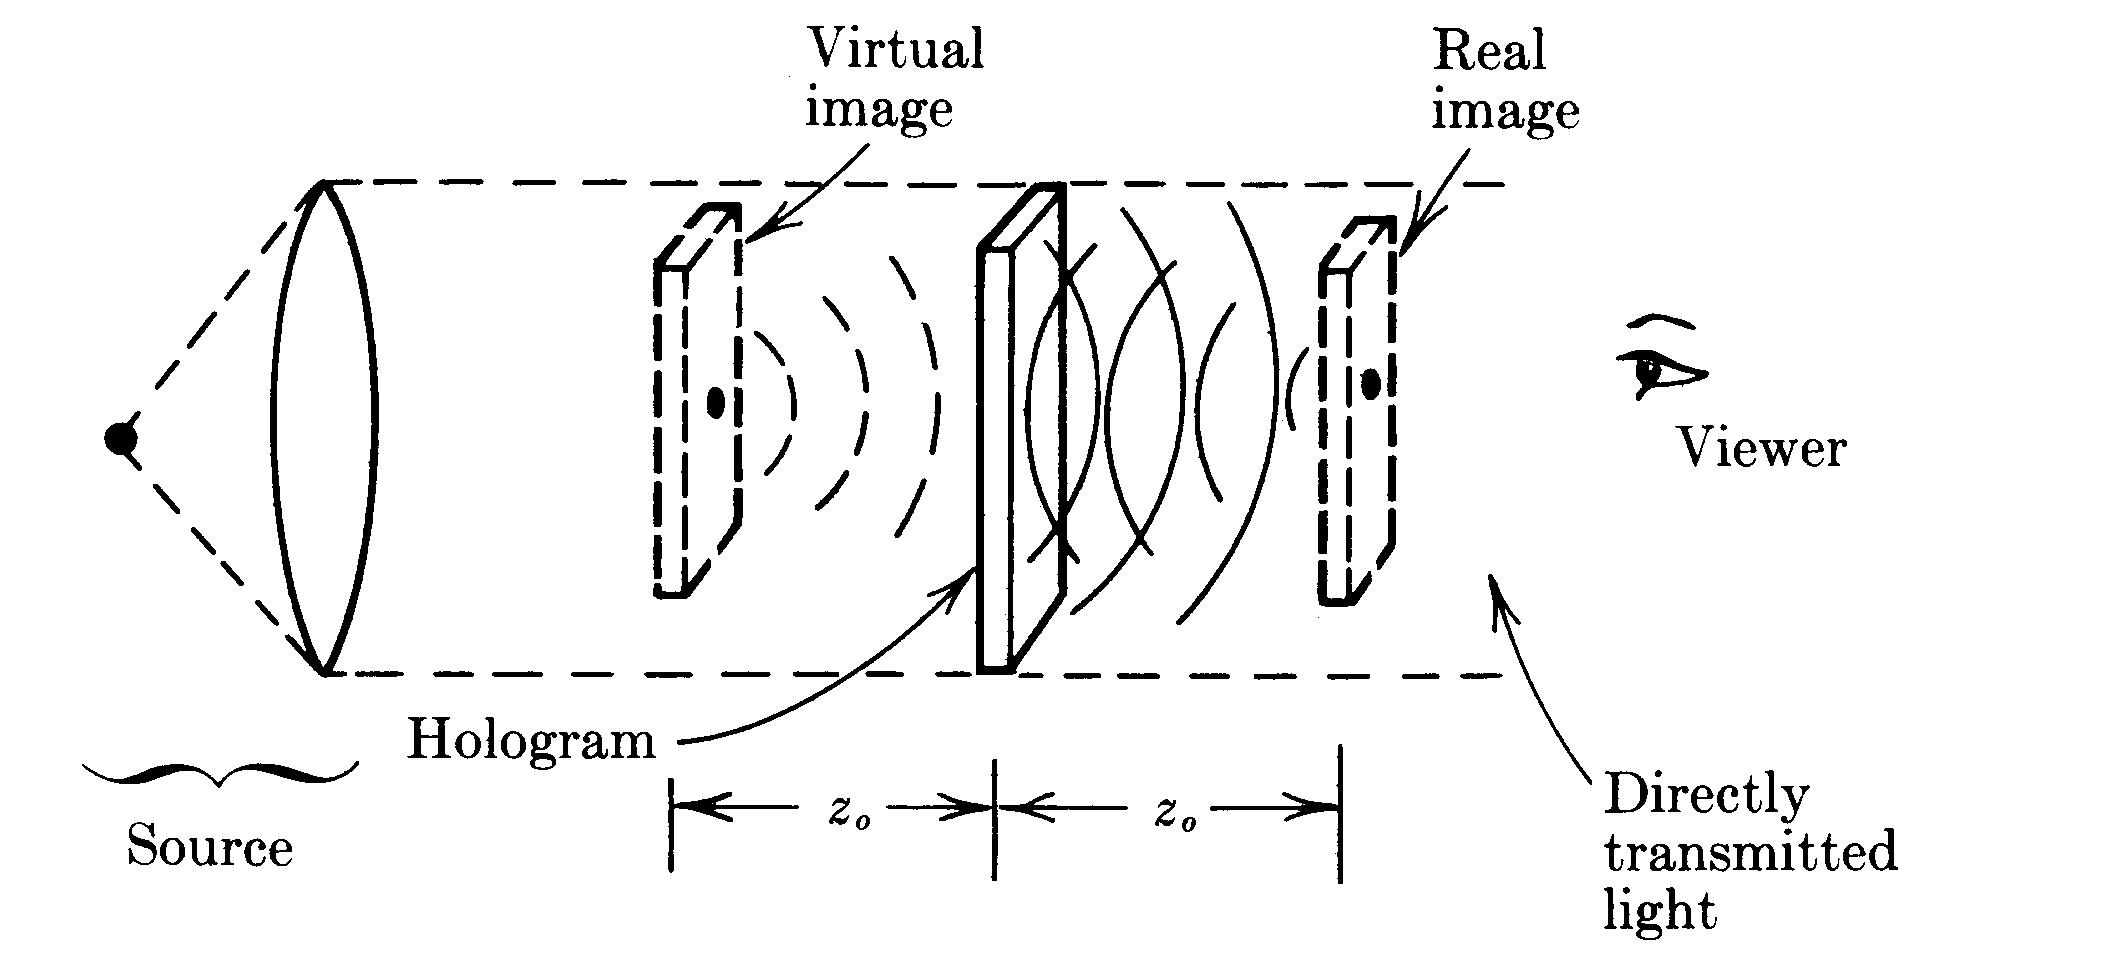
The transmitted wave has the following amplitude.

where B is a uniform plane wave of uniform amplitude and beta is some constant related to the development of the film. The first term is just a plane wave. The second term can be ignored because the amplitude of the reference wave is much larger than the amplitude of the scattered wave. The third and fourth terms represent the original scattered wave as virtual and real images respectively. These two images are called twin images and are 2z apart on axis. These twin images provide one of the limitations of Gabor holography. When one image is brought into focus the other out-of-focus image is also present. With this setup the two images cannot be separated. The other limitation is the requirement that the object be highly transparent, so that the amplitude of the scattered wave is greater than the amplitude of the plane wave. Without this requirement the second term of the wave amplitude transmitted through the hologram cannot be ignored.
Wavefront Propagation[2]
The process of making a hologram and reconstructing the image are conceptually the same. Either the object or the hologram is illuminated by plane waves, the transmitted waves propagate for some distance and interfere with a reference beam. The goal is to find the wavefield some distance z away from some object with complex transmittance. This is done by assuming that each point on the object is a point source of spherical waves with amplitude proportional to the complex transmittance of the object. All the spherical waves are summed at z, and the Kirchhoff boundary conditions are applied to solve the equation. For this I used an algorithm written in idl (Interactive Data Language) for the purpose of propagating images a specified distance. For further information on the calculation of the propagator or specifics about this algorithm see Stephen Lindas's graduate thesis [2].
The program that I will use can propagate the image any distance, but what is the optimum distance to create a hologram. A single point produces a hologram that resembles a Fresnel zone plate.
Figure 2: Hologram of a single point [2]
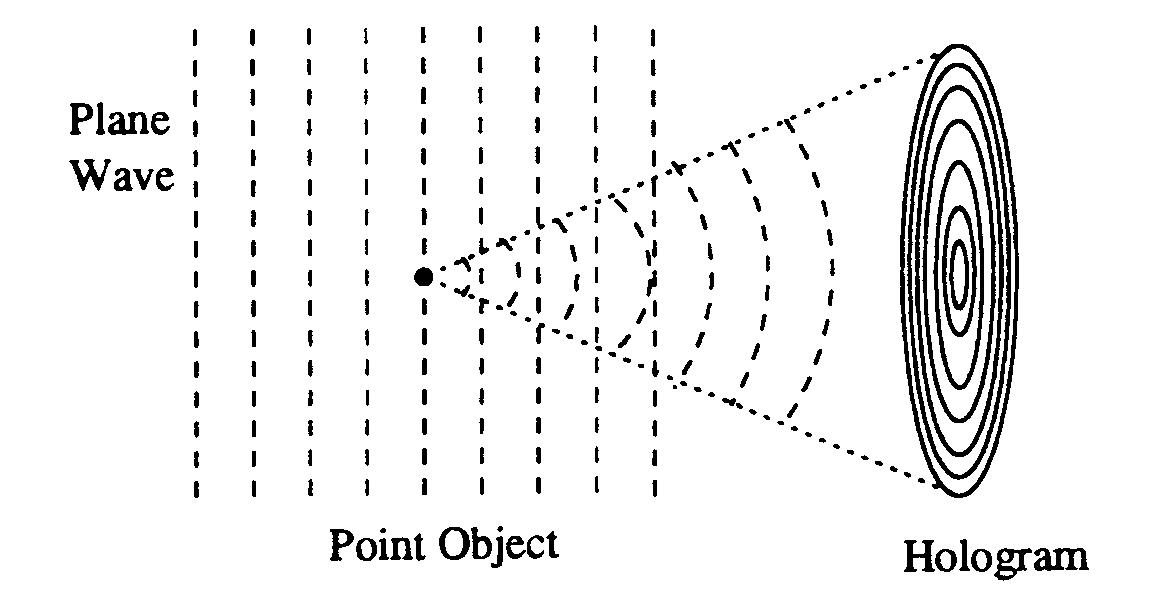
So a hologram of an image with many points can be viewed as a superposition of Fresnel zone plates. We can exploit this fact to aproximate the maximum resolution of a hologram. The focal length of a zone plate is
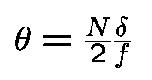
Theta is the angle between the center and the edge at the focal length, delta is pixel size and N is the number of pixels. The Rayleigh resolution criterion is
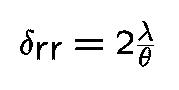
The two comes from the fact that we are using a rectangular plate. We take the Rayleigh resolution to be the size of the smallest possible zone, the size of one pixel. So the optimum resolution would occur for a propagation distance of
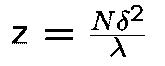
The hologram will eventually br printed on a 35 mm slide with 4096 pixels. For an image with 4096 pixels the pixel size is 8.55E-6 meters. A HeNe laser will be used for reconstruction so lambda is 632 nm. The optimum resolution for these values will occur at 0.47 meters. When using the idl algorithm these values for the wavelength, pixel size and propagation distance were used.
Computer Generated Holograms
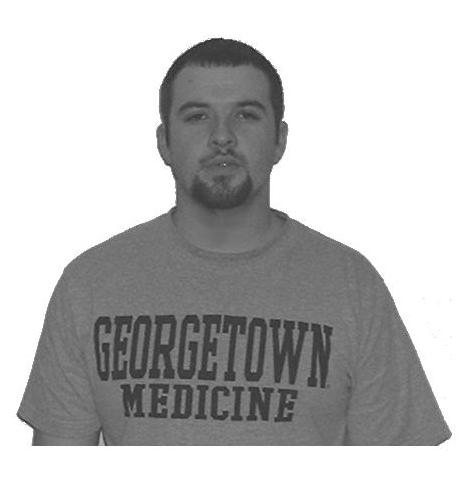
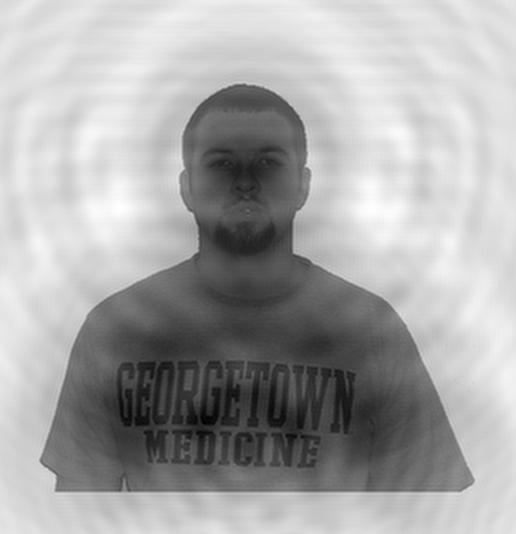
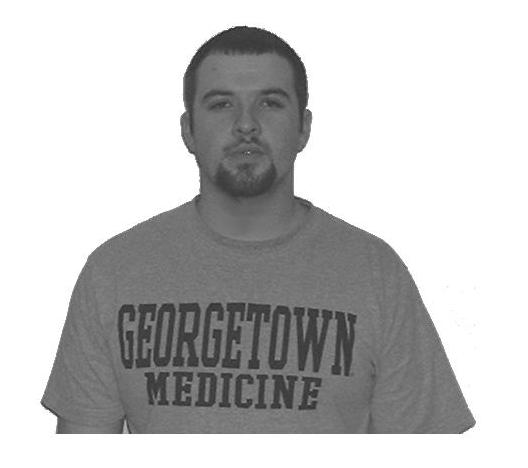
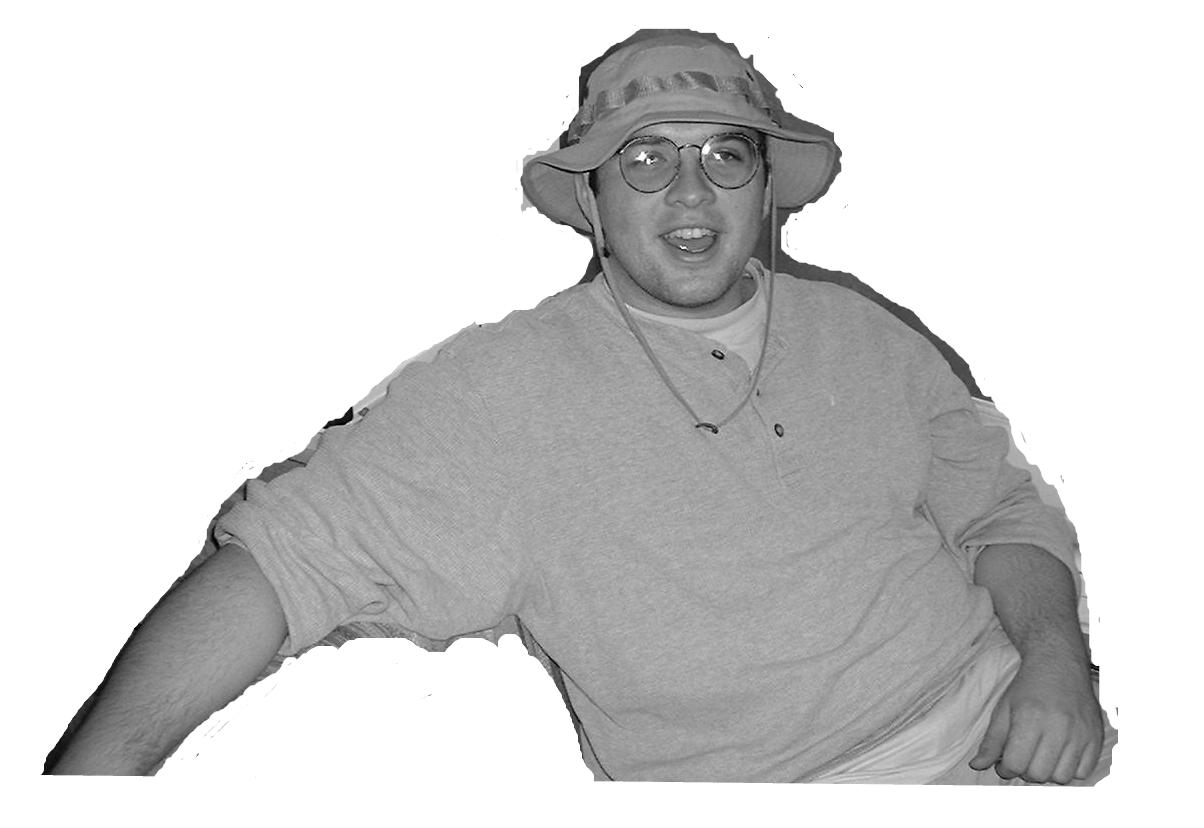
First a image was taken of an object (me). The image background was removed and whitespace added around the object to obtain higher transmission. Remember this was one of the requirements to ignore one of the terms.
Original Image
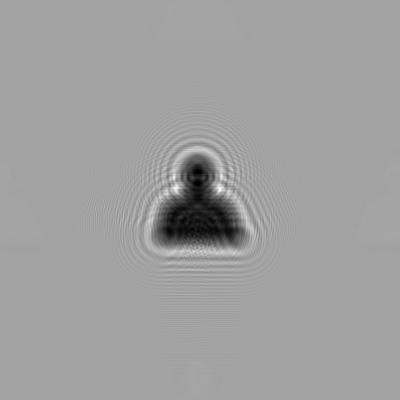
Then the image was propagated to the optimum z using the idl routine. The hologram is shown below..
Hologram
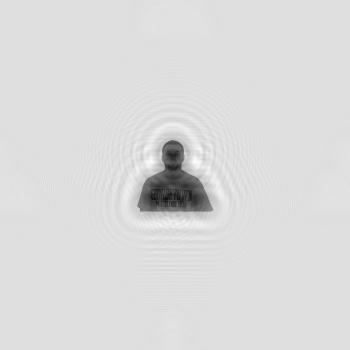
Then the a theoretical reconstruction of the image was created by propagating back.
Reconstruction
The out of focus twin image shown below, interferes with the reconstruction.
Twin Image
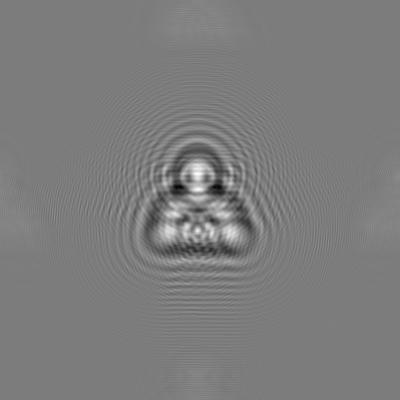
Reconstruction
The gif files with the various holograms were transferred to film. I then had 35 mm slides of the holograms printed by Color Image Labs in Smithtown, New York. For the reconstruction a HeNe laser is aligned with the pinhole. A lens is placed a focal length from the pinhole so that light coming out of the lens is assumed to be plane waves. These plane waves illuminate the hologram and should produce an image a distance z from the hologram. I tried three different images shown below with a table that gives the values assumed when producing the holograms.
The Three Stooges
| Object | # pixels | Object Size | Pixel Size (m) | Projection Distance (m) |
| 1 | 2000 | 450 | 1.75E-5 | 0.9691 |
| 2 | 1000 | 150 | 3.50E-5 | 1.938 |
| 3 | 4096 | 800 | 8.55E-6 | 0.4732 |
For image 3 the hologram and theoretical reconstruction are shown below.
I know the reconstruction is hard to see, but imagine how hard it is to see in the lab! Lets zoom in!
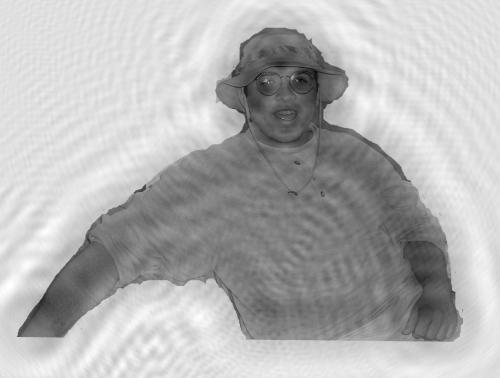
But for plane wave illumination the image is only 6.84 mm high. Ughh! So far I have only had moderate success reconstructing the images. I have been able to make out my glass and hat in the third picture. The image is fairly small so I might need to magnify the image to see anymore detail. Another problem maybe that I have not been careful enough when looking for the focused image. I calculated the depth of focus to be less than half a millimeter. So I need to find a way to move the screen at least that accurately if I want to be sure to go through the focus. I am going to try to rule out these possible problems before I abandon the holograms. So the search will continue!
Douglas Bennett
Douglas.Bennett@sunysb.edu