Demonstrating Concepts of X-Ray
Absorption Spectroscopy with Microwaves
By Christina Zayas
Mentors:
John Noé, Laser Teaching Center
Vivian Stojanoff, National Synchrotron Light Source
Why the Laser Teaching Center?
Upon entering the Laser Teaching Center, my knowledge of optics was based on what I read in a textbook by Giancoli in my senior year Advanced Placement Physics class. Needless to say, my experience with optics was not expansive and not in the least bit exciting. This was the reason why I chose to work in the Laser Teaching Center. Like many students who enter the LTC, I was impressed by the variety of projects and quickly learned that optics was a lot more than ray diagrams. The various means in which optics can explain natural phenomena and its infinite applications are present in our every day lives.
Choosing a Project
The LTC is distinct in that you are given the freedom to explore your interests. This worked to my advantage because I was able to combine my work at the LTC with my project at the National Synchrotron Light Source (NSLS). At the NSLS, I am learning how to analyze and interpret Extended X-ray Absorption Fine Structure (EXAFS) data. To further my understanding of EXAFS, I chose to develop microwave demonstrations that would highlight concepts of EXAFS or X-ray Absorption Spectroscopy (general term). My project highlighted the precise wavelength selection
Background
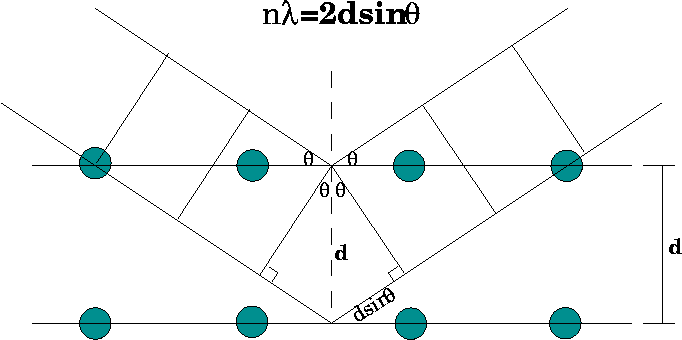
X-ray absorption spectroscopy (XAS) is a powerful technique used for material characterization. Similar to the way that each human being has a unique set of fingerprints, each material has a characteristic x-ray absorption spectrum. In the XAS experimental beam line set-up, there is a monochromator that consists of two angled silicon crystals. The two crystals serve as mirrors, but rays are only reflected at certain angles where they constructively interfere. These angles can be calculated by using the Bragg law which is why this process is also called Bragg diffraction. The key difference between diffraction and Bragg diffraction is that diffraction is two dimensional and Bragg diffraction is three dimensional. The purpose of Bragg diffraction is to take polychromatic x-rays and make them monochromatic at a specific wavelength that would fit a particular sample.
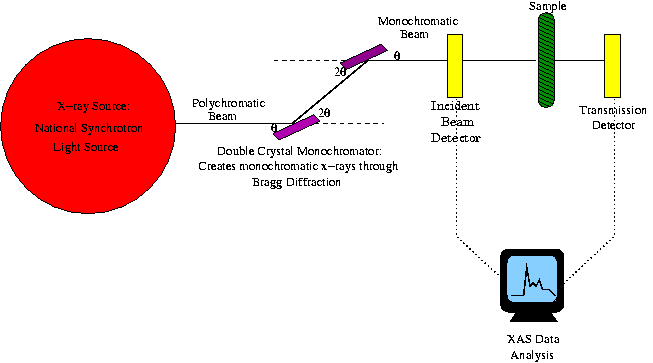
This is the diagram of the NSLS beam line. The purple rectangles symbolize the monochromator which is what I studied.
The crystals in the monochromator take polochromatic x-rays and make them monochromatic through Bragg diffraction.
The wavelength of x-rays is in the range of 10 to 0.01 nanometers whereas the wavelength of the microwaves can be measured in centimeters. Although the wavelengths are different, x-rays and microwaves are both forms of electromagnetic radiation and thus the same laws apply. As a result, a microwave demonstration of the Bragg diffraction that occurs within the monochromator would be a success.
Experimental Procedure
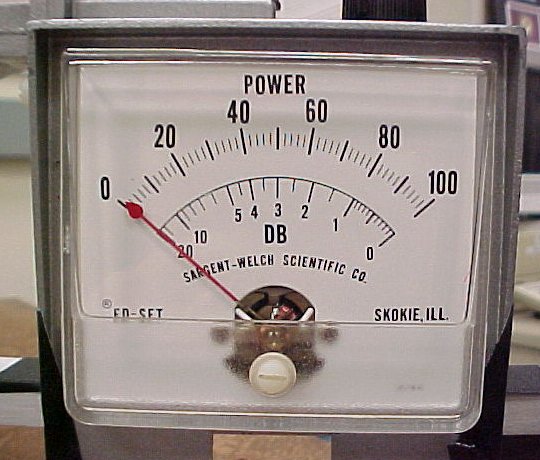
My first experiment was to measure the wavelength of the old microwave set in order to calculate the Bragg angles when it was time to do the Bragg diffraction part of this experiment. The microwave set consisted of a microwave transmitter, a receiver which gave a value of intensity, a goniometer, a metal plate, and a Styrofoam block simulating a crystal. I simply placed the receiver at one end of a ruler and the transmitter at the opposite end and moved the transmitter toward the receiver in millimeter steps. I recorded at what distances the max and min's occurred as well as their corresponding intensities. I plotted the pointed and then figured out the wavelength to be 1.48 centimeters.
The second experiment was to explore the law of reflection. I simply placed the receiver and the transmitter each 45° away from the normal. A placed the metal plate perpendicular to the normal and began to move the receiver and transmitter in 1° steps. Next, I recorded the intensity value at each degree change. Last, I plotted the values from the experiment and had a graph of half the peak at which reflection occurred and multiplied by two so that I could have a complete peak. The purpose of this experiment was to show me how the law of reflection works since Bragg diffraction works similar to the law reflection, but only at certain angles where constructive interference occurs.
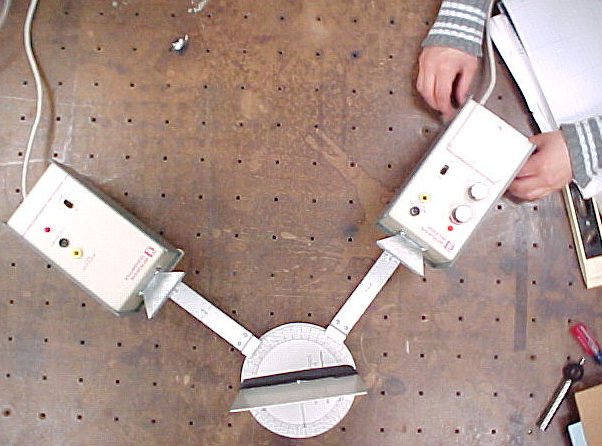
This is the set-up for the reflection experiment using the old microwave machine.
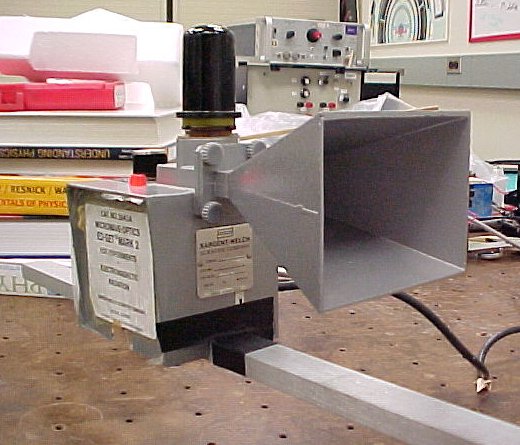
The picture to the left is the receiver and the picture to the left is the transmitter.
I was ready to move on to the Bragg diffraction experiments when I was given a new microwave apparatus. With the old set, I was having problems using the goniometer because it was too small for the crystal. As a result, we assumed that the wavelength would be different and thus, I had to repeat experiment number 1. In the end, we learned that the wavelength of the new apparatus was the same as the old one. Not only this, we realized that we made a stupid error!!! The wavelength was twice the amount of what was calculated in step one because when the wavelength is squared, the troughs becomes positive and the wavelength is twice greater. Our new wavelength was 2.96 +/- 0.1 cm.
After calculating the correct wavelength, I calculated the theoretical
Bragg peaks for the crystal plane 100 and 110 (diagonal). I then set
up the crystal (as shown below) at plane 100 and tried to find the
peaks experimentally. This was achieved through moving the
transmitter and receiver simultaneously in 1° steps and
recording the corresponding intensities. Where the values seem to
suddenly increase, I went back and found the intensities in half
degree increments surrounding the intensity jumps of my previous data.
A repeated the same steps with plane 110.
In addition, we found that it would be a good idea to calculate the background. So we went back and removed the crystal and we repeat the experiment. Ideally, if you subtracted the background from the data, you would see the actual results.
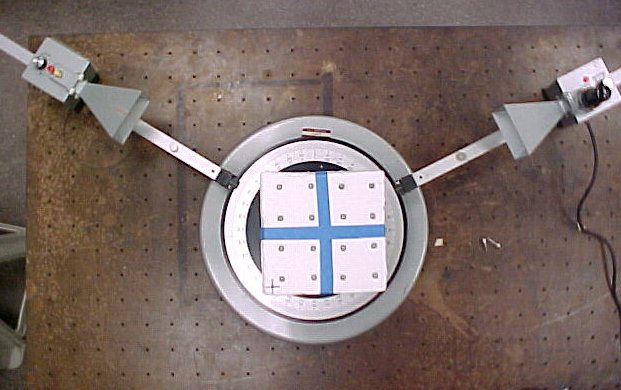
This is the set-up for the Bragg diffraction experiment. This is the 100 crystal plane.
Results
For the most part, the theoretical Bragg peaks at the two different planes are visible using the cube. However, as you can tell from the graph of plane 100, the first peak is bit premature and it gets swallowed up by the background. This error could be due to the fact the metal balls (1 inch in diameter) are not quite evenly spaced within the cube and I had to take an average of the spacing. This perhaps could have affected my data.
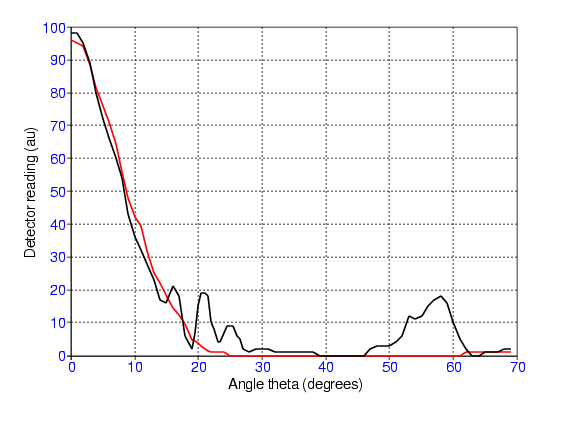
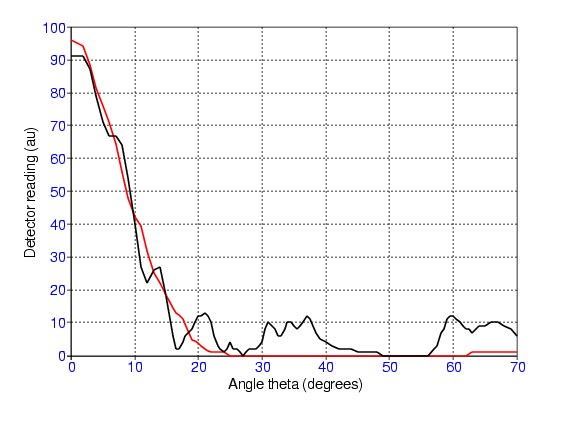
These are the graphs of both the crystal 100 plane and the 110 plane. If you take a look at the 100 plane, you can not really view the first theoretical Bragg peak clearly, however, you are able to view the other two peaks pretty well. In the 110 plane graph, the two Bragg peaks calculated are seen more or less at the predicted locations.
Conclusion
We determined that using a microwave apparatus as a demonstration of the Bragg diffraction that occurs within the NSLS monochromator would be feasible. The main difference between the microwave apparatus and the NSLS monochromator is that the microwave apparatus has a fixed wavelength whereas in the NSLS you are using the monochromator to get a single wavelength that would be suitable for the sample. In summary, the demonstration would work if you theoretically calculate the Bragg angles before hand. This would be a demonstration that people may not be able to do on their own, however, with the help of another, the concept will be apparent.
| Christina Zayas Spring 2007 Home |
Laser Teaching Center |